Latest forecasts show drought continuing into summer.
Key Points
- Drought continues across the Intermountain West.
- Annual spring snowmelt has begun with most of the West seeing below median snowpack for this time of year.
- Seasonal forecasts show drought continuing for most of the West, but hint at a potential for an active monsoon later in the season for southern Arizona.
Current U.S. Drought Monitor map for the Intermountain West Drought Early Warning System (DEWS) region with data valid for April 19, 2022. The U.S. Drought Monitor is updated each Thursday to show the location and intensity of drought across the country.
21.4% of the Intermountain West DEWS region is experiencing extreme to exceptional drought (D3–D4).
U.S. Drought Monitor Categories
Current U.S. Drought Monitor map for the Intermountain West Drought Early Warning System (DEWS) region with data valid for April 19, 2022. The U.S. Drought Monitor is updated each Thursday to show the location and intensity of drought across the country.
21.4% of the Intermountain West DEWS region is experiencing extreme to exceptional drought (D3–D4).
Current Drought Conditions and Outlook
U.S. Drought Monitor Conditions
- There has been little change in drought conditions across the Intermountain West.
- Exceptional (D4) drought exists in the region in northeastern and southern New Mexico and has recently expanded into the southeast corner of Colorado.
- 21% of the region is experiencing extreme (D3) drought or worse.
- Extreme (D3) drought conditions have been in place in this region since May 2020.
- Moderate (D1) or worse drought has been in the region since August 2009.
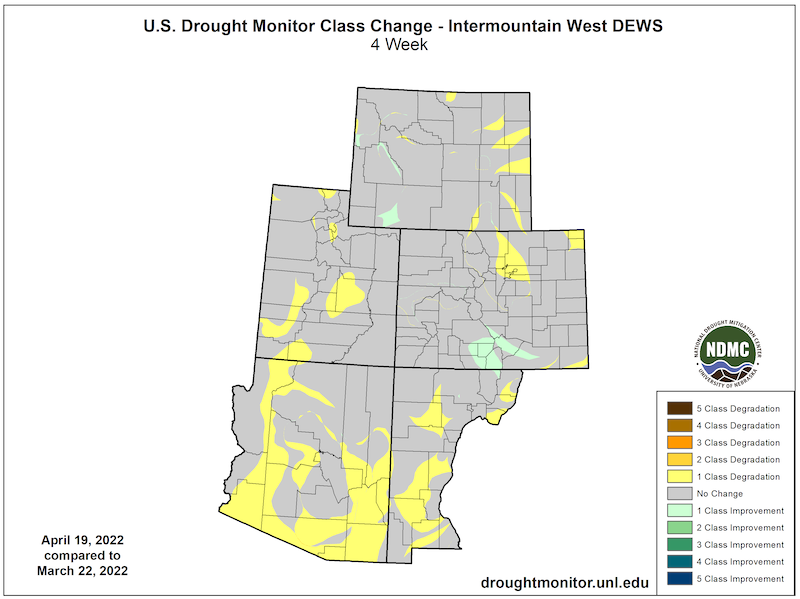
U.S. Drought Monitor 4-Week Change Map
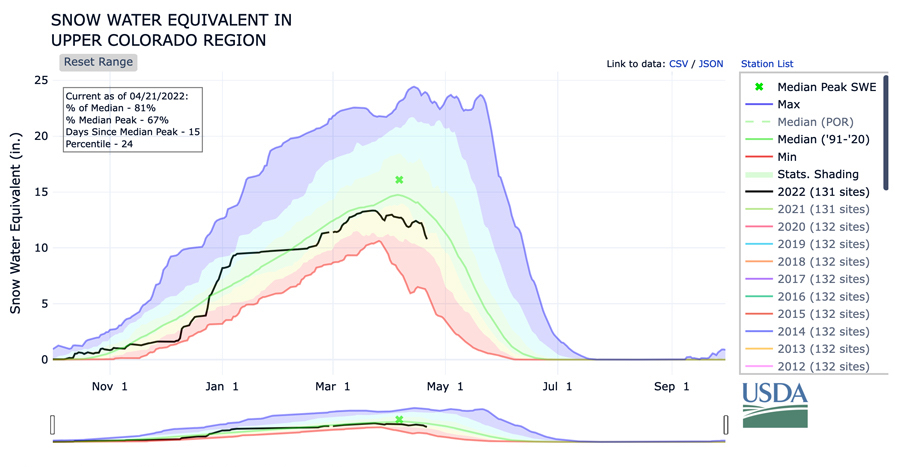
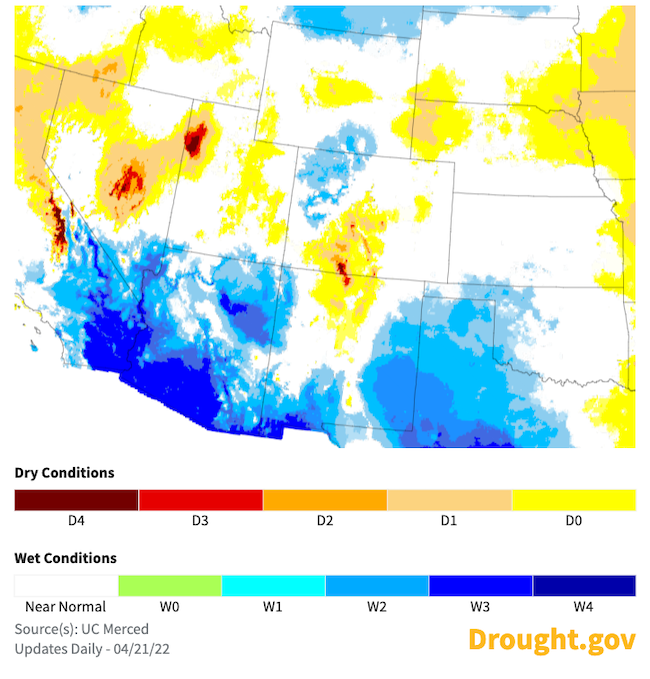
Current Snow Water Equivalent (SWE)
- Upper Colorado River snow water equivalent (SWE) is currently at 83% of median for this time of year. Snowpack usually reaches its peak accumulation on April 6 in the Upper Colorado River Basin. Current SWE is 69% of the historical average peak value.
- Following low precipitation totals in January and February, March and April snow accumulation kept the snowpack just below the median for the season.
- April–July water supply volume forecasts are near to much below average across the Upper Colorado River Basin. Mid-April Upper Colorado River Basin water supply guidance generally ranges between 45%–100% of the 1991–2020 historical average.
- Snowmelt across the West has begun a little earlier than usual.
Snow Water Equivalent: Upper Colorado
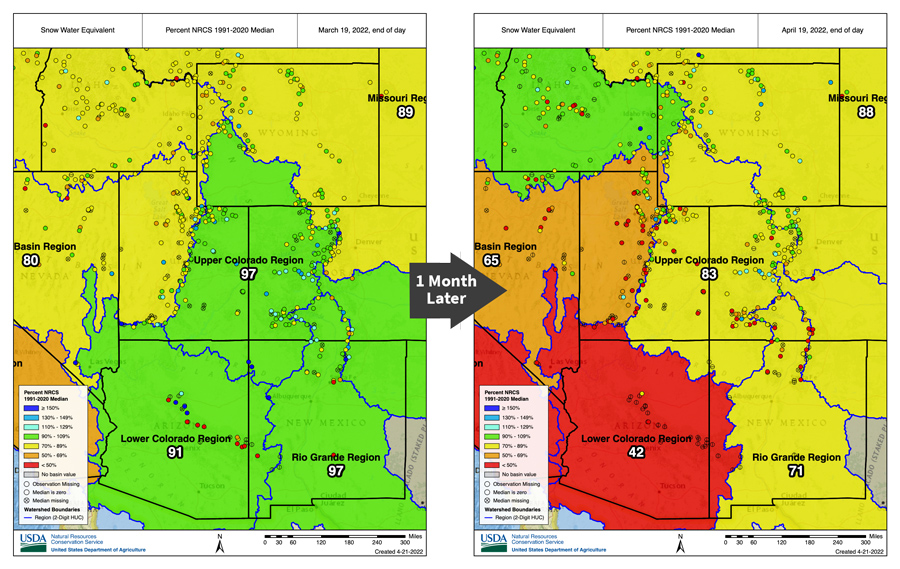
Snow Water Equivalent Percent of Median: March 19 to April 19, 2022
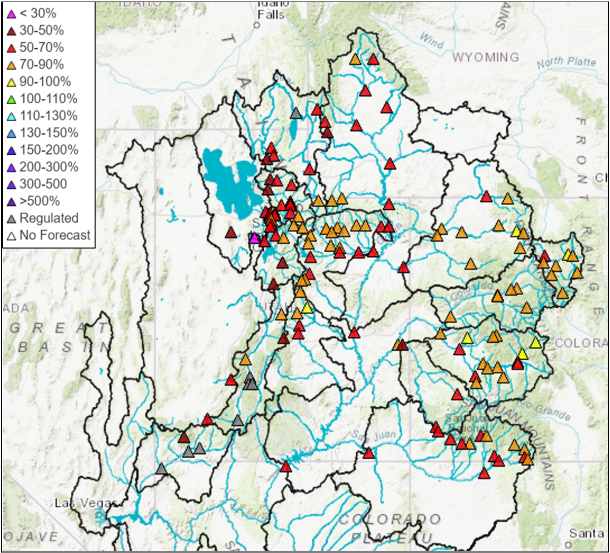
April–July Runoff Volume Guidance
Forecasts and Seasonal Outlooks
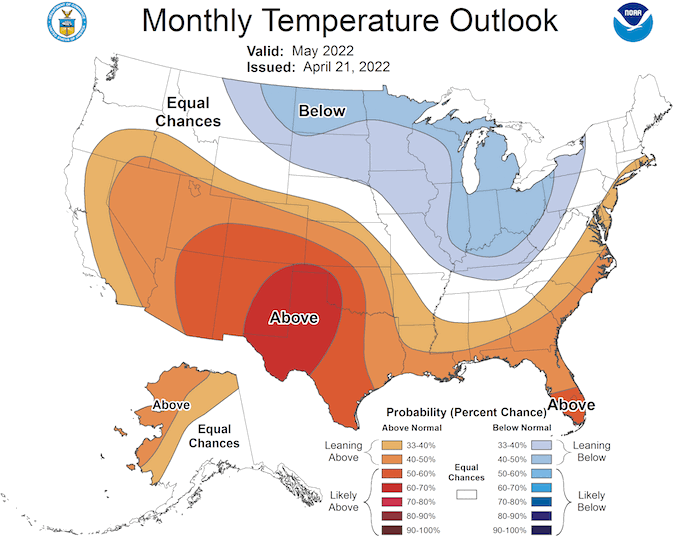
May 2022
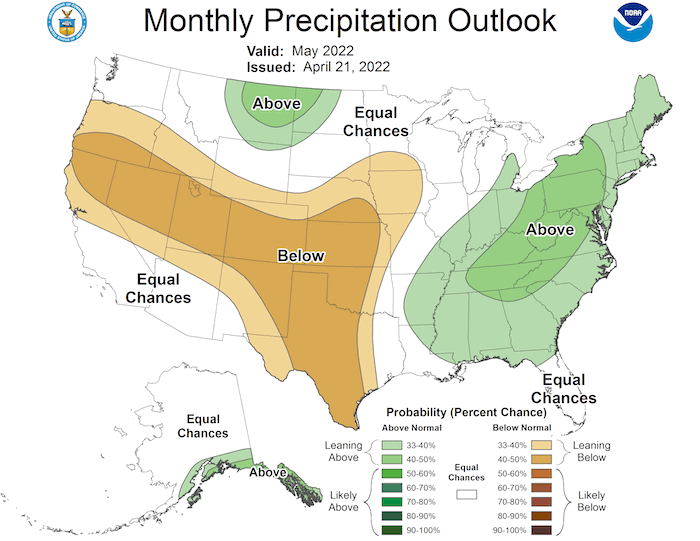
- The monthly outlook for May shows:
- Increased temperatures are likely for the 4 Corners states.
- Below-normal precipitation is likely for Utah, Colorado, and New Mexico. Note that spring is usually the driest season for Arizona and New Mexico.
- The 4-week Evaporative Demand Drought index (EDDI) forecasts shows increased evaporative demand for southwest Utah but less evaporative demand across southern Arizona and New Mexico.
May 2022 Temperature Outlook
May 2022 Precipitation Outlook
Evaporative Demand Drought Index (EDDI) 4-Week Forecast
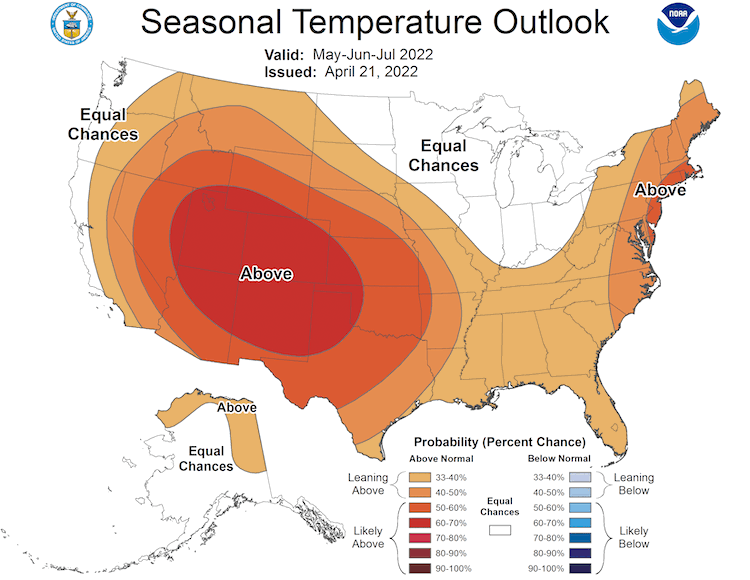
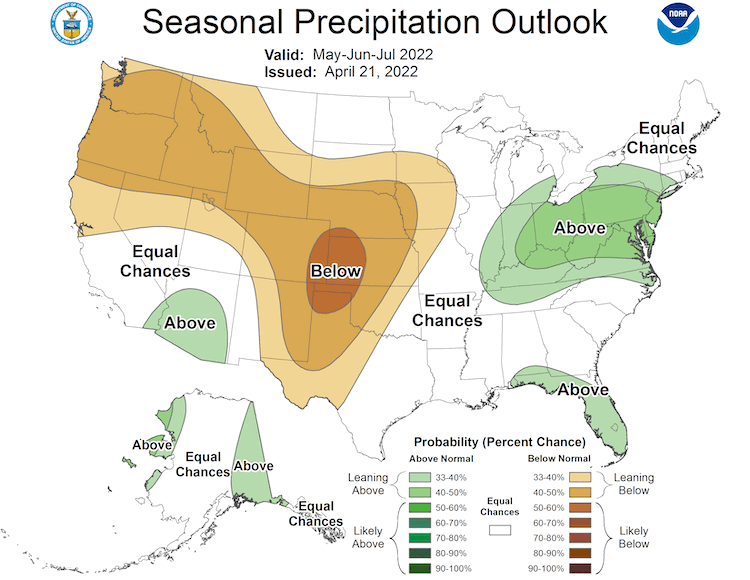
3-Month Outlook for May–July 2022
Seasonal forecasts show a hotter than normal season ahead for the Intermountain West with a hint of the Southwest monsoon later in the season.
- Odds strongly favor increased temperatures through spring and early summer 2022 for the Intermountain West.
- Lower-than-normal precipitation is more likely than not for Colorado, Wyoming, northern Utah, and eastern New Mexico.
- Odds slightly lean toward above-normal precipitation for southern and central Arizona for the May–July season. May and early June are usually very dry for Arizona, and the Southwest monsoon usually begins sometime after June 15.
- Summer precipitation for the Southwest will be better understood as the season gets closer.
Three-Month Temperature Outlook: May–July 2022
Three-Month Precipitation Outlook: May–July 2022
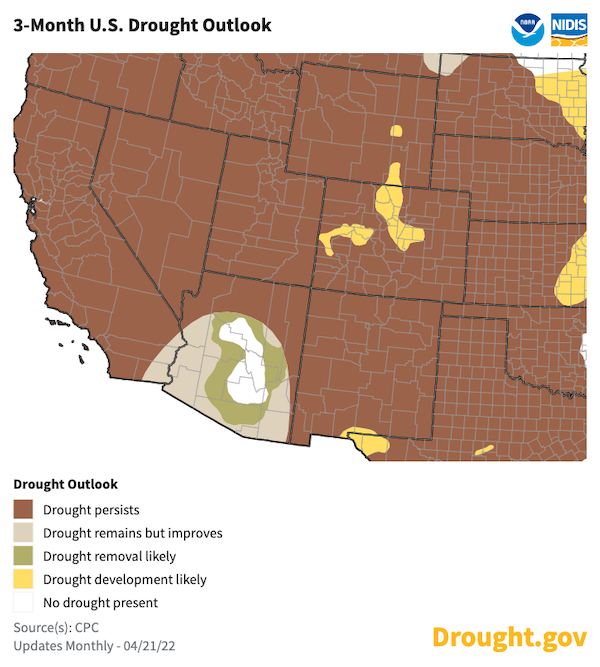
Seasonal Drought Outlook
- The 3-month drought outlook shows drought is expected to continue for the Intermountain West.
- The latest seasonal drought outlook follows the seasonal precipitation forecast for a slight chance of above-normal summer precipitation in southern and central Arizona. This could allow for possible improvement of drought conditions in southern Arizona by the end of the season.
U.S. Drought Outlook: April 21–July 31, 2022
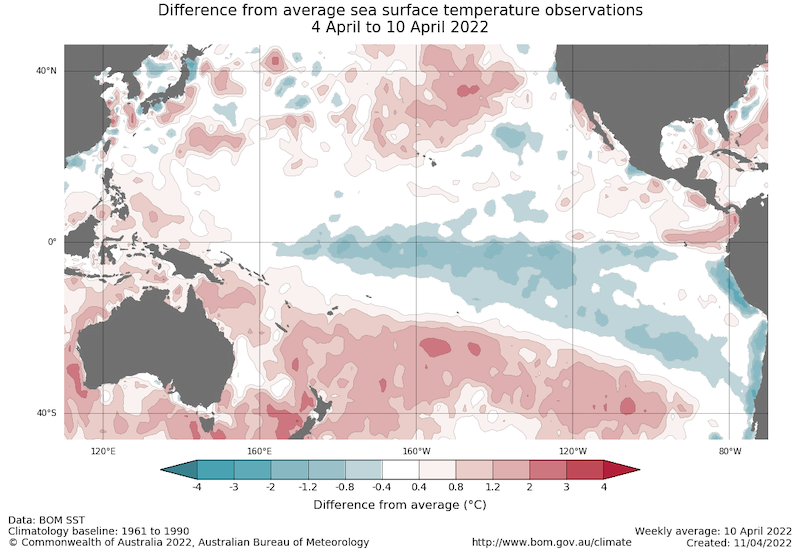
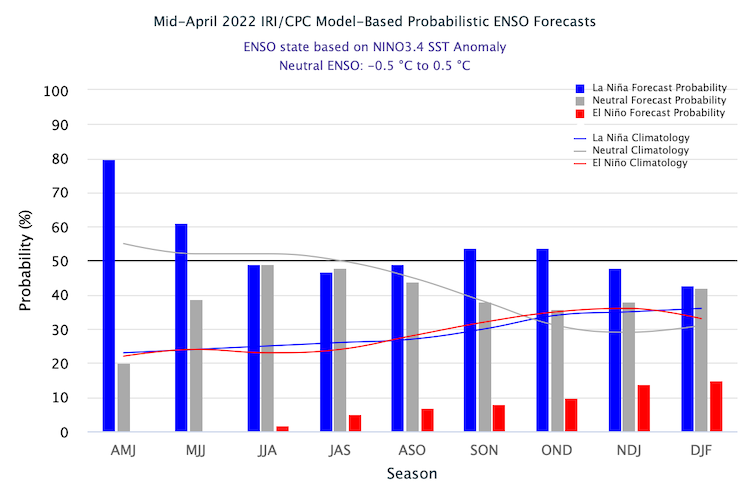
La Niña to Continue Through Spring and Possibly into Summer
- One of the primary drivers of drought across the Southwest through winter and spring was a La Niña pattern in the Pacific.
- The April 10 weekly NINO3.4 value was −0.70 °C, indicating a La Niña pattern persists in the central Pacific.
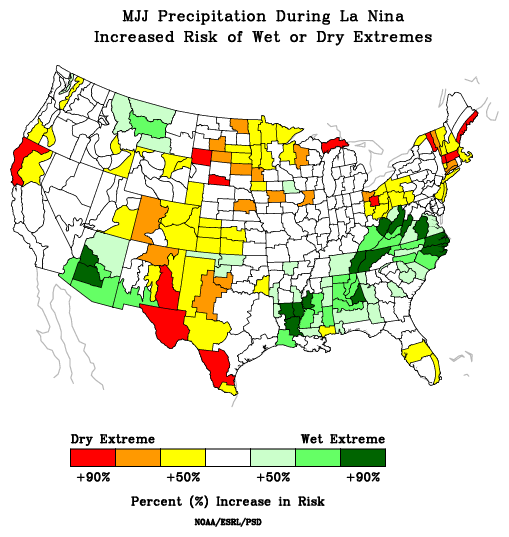
- La Niña patterns do not usually persist into northern-hemisphere summer months, but the few historical events that have persisted experienced increased precipitation in Arizona, decreased precipitation in Colorado and New Mexico, and a mixed result for Utah. No two La Niña patterns are the same.
- For more information, please check out the NOAA El Niño–Southern Oscillation (ENSO) blog.
Sea Surface Temperature Anomalies (°C) for April 4–10, 2022
Risk of Wet/Dry Extremes in May–July During La Niña
Probability of El Niño, La Niña, or Neutral Conditions
State-Based Conditions and Impacts
Arizona
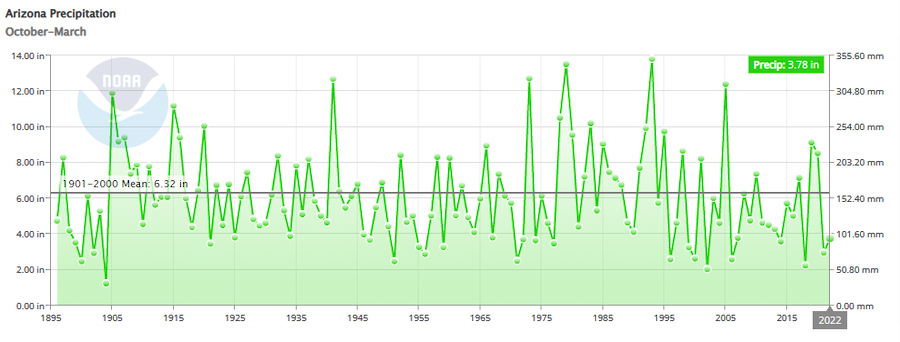
- Arizona has entered its climatologically driest months: April, May, and June. Precipitation was below average for much of the state in March, especially in central and southern Arizona. Precipitation for the water year to date is significantly below average.
- The Tunnel Fire in Coconino County was updated to a Type 1 Incident Management Fire, with more than 20,000 acres of primarily grasslands already burned, several structures destroyed, and hundreds evacuated as of this publication. Evacuations were also ordered for the Crooks Fire in Yavapai County.
October–March Statewide Precipitation: 1895–2022
Colorado
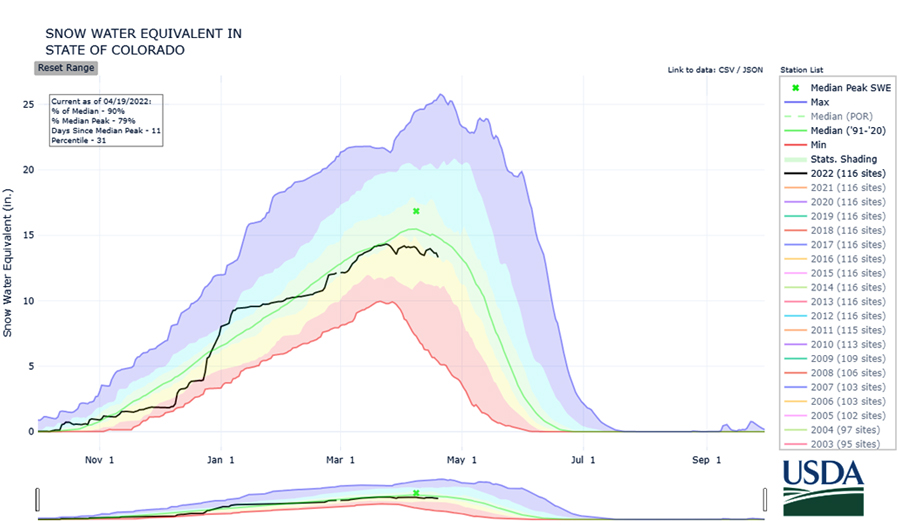
- March was a near-normal month for Colorado both for temperature and precipitation. Snowfall rates in the mountains picked up from low values in January and February for the first half of March.
- Snowpack peaked at 75%–90% of normal peak values depending on the basin. It is now (mid-April) melting quickly, especially in southern basins such as the San Juan. Runoff values will likely be lower than 75%–90% of normal due to dry antecedent soil conditions and what has been a dry spring season since snowpack peaked.
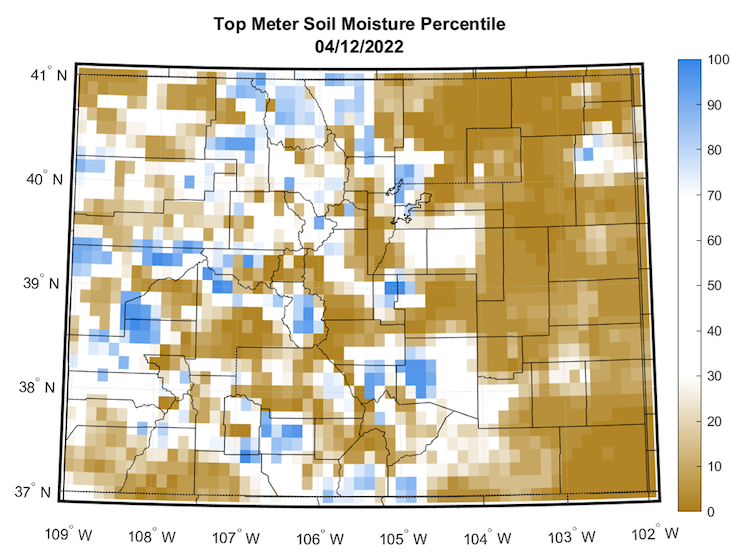
- Conditions have taken a concerning turn in April. While the first half of April was cooler than normal for Colorado, it was also much drier than normal for all but the northern Rockies. Spring is the time of year in which precipitation rates are supposed to pick up on the eastern plains, replenishing soil moisture to support new crop and forage growth. Much of the eastern plains of Colorado have received no moisture thus far in April.
- Soil moisture on the eastern plains is very low. January and February snows helped for some, but there was not enough moisture to replenish soils following a warm, dry summer and fall.
Statewide Snow Water Equivalent (SWE)
Top Meter Soil Moisture Percentile
New Mexico
- According to the U.S. Department of Agriculture, 80% of topsoil moisture is in the very short to short condition, and 70% of winter wheat in the very poor to poor condition as of April 17, 2022.
- Due to the low topsoil moisture, many farms and ranches were reporting negative impacts from wind erosion causing deteriorating air quality. Numerous dust storms have impacted areas in southern and eastern parts of the state.
- Several wildfires are burning across the state. The three largest—the Cooks Peak Fire, Hermits Peak Fire, and McBride Fire—burned a combined 34,732 acres as of April 21. These fires are burning over drought-stressed forests and grasslands.
- High-elevation New Mexico snowpack is holding on but is below average in the Rio Grande Basin, ranging from 73% to 54% of medial SWE as of April 21. Pecos SWE is at 23% of median and will likely melt out close to a month earlier than the median. Lower basins in the Gila and Rio Hondo have already melted out. As a result, below-normal streamflow is expected on all major rivers this spring along with shortened irrigation seasons.
- Less than an inch of precipitation has fallen in many areas of eastern New Mexico since New Year's Day. Only 0.18 inch has been recorded at the Carlsbad airport in 2022.
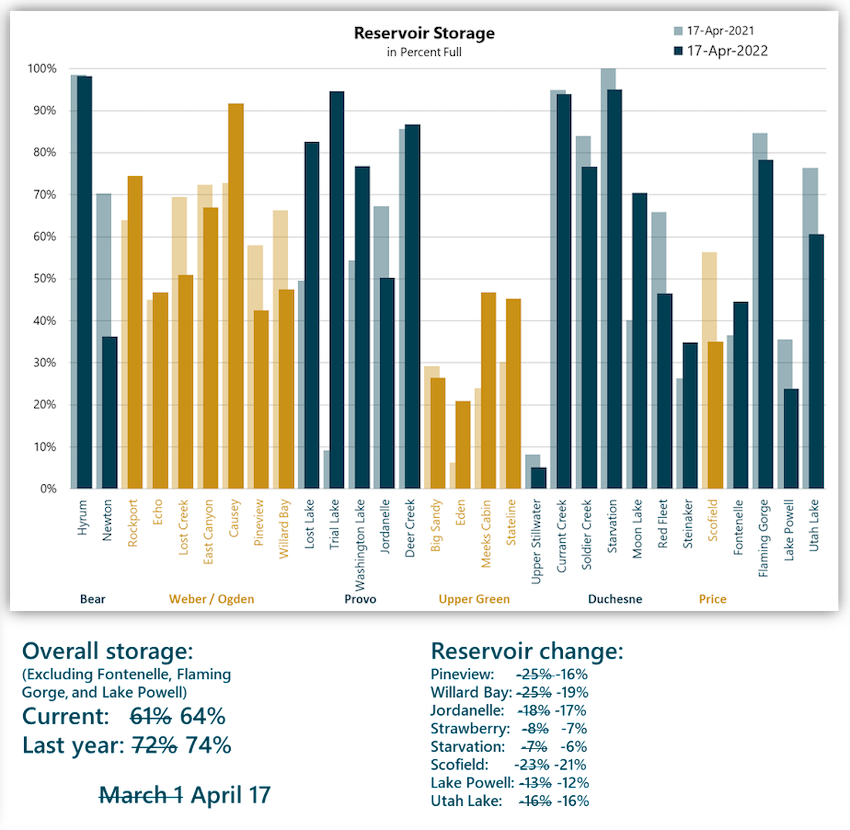
Utah
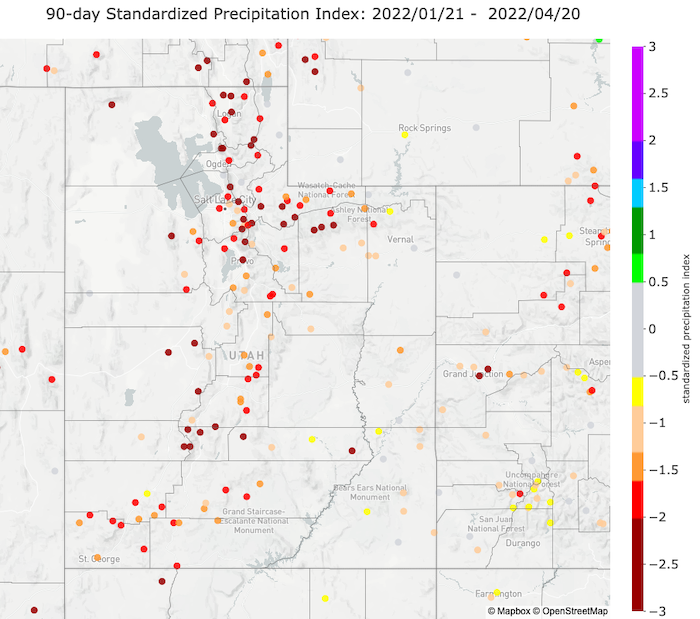
- Early spring runoff and underwhelming March and April precipitation have introduced drought intensification concerns over the short- and medium-range timescales.
- 90-day Standardized Precipitation Index values across the state highlight the failure of January–April precipitation, despite a few episodic beneficial storm cycles.
- There has been a broad reduction in reservoir levels, which are ~10% lower statewide than this time last year, highlighting the ongoing extreme hydrologic drought that will not be improved from this year’s below-normal spring runoff.
90-Day Standardized Precipitation Index (SPI)
Utah Reservoir Storage: April 17, 2021 vs. 2022
April–July Streamflow Volume Forecasts
Wyoming
- Precipitation:
- Recent snows have helped the snowpack considerably compared to a few weeks prior. While many western basins are still below the median, they have gained ground even in mid-April.
- In the east, the Laramie River Basin has reached 102% of median snow water equivalent (SWE), the only basin to break the 100% point. While almost all basins look to be peaking below the median SWE value, the date of that peak SWE has been later than the median date in at least 8 of the 14 Basins (6-Digit HUC) of Wyoming.
- Soil Moisture: As a result of recent precipitation, soil moisture has improved in recent weeks with parts of the far west and southwest along with west-central and east central Wyoming moving above the 10th percentile.
- Temperatures:
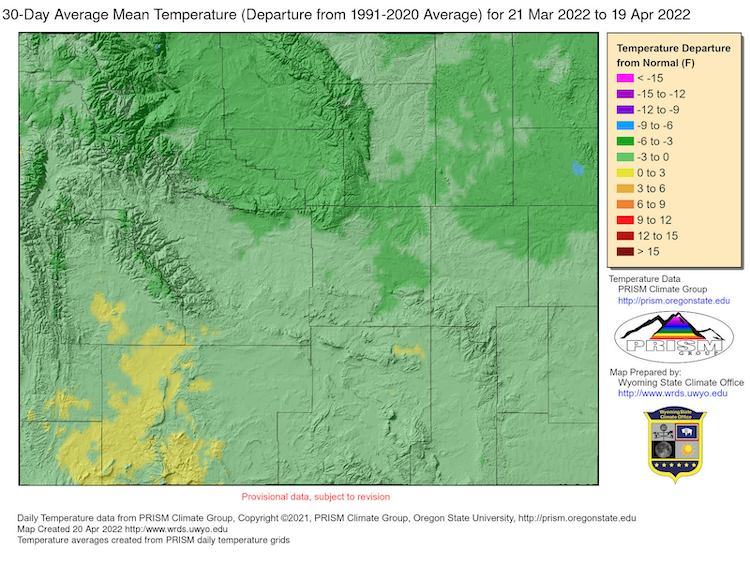
- Below-normal temperatures dominated the last 30 days in Wyoming with the exception of parts of the Green River Basin. The northern part of the state saw the greatest negative departures from normal, with much of the region reaching as much as 6ºF below normal.
Average Mean Temperature: March 21–April 19
For More Information
More local information is available from the following resources:
- Your state climatologist
- Your local National Weather Service office
- Western Water Assessment: Intermountain West Climate Dashboard
- Climate Assessment for the Southwest: Southwest Climate Outlook
In Case You Missed It
- March 28, 2022: California-Nevada Drought & Climate Outlook Webinar
- March 29, 2022: Soil Moisture Webinar Series — Practical Applications of Soil Moisture Information
- April 5, 2022: Southwest Drought Briefing: A Focus on Snowpack
Upcoming Events
- June 2, 2022: Drought Update and Wildfire Outlook Webinar for California and the Southwest
- June 7–8, 2022, Las Cruces, New Mexico: Southwest Drought Learning Network Annual Meeting
Prepared By
Joel Lisonbee
NOAA/National Integrated Drought Information System (NIDIS)
Erin Saffell
Arizona State Climatologist/Arizona State University
Peter Goble
Colorado Climate Center/Colorado State University
Jon Meyer
Utah Climate Center/Utah State University
Tony Bergantino
Water Resources Data System – Wyoming State Climate Office
This drought status update is issued in partnership between the National Oceanic and Atmospheric Administration (NOAA), and the offices of the state climatologist for Arizona, Colorado, New Mexico, Utah and Wyoming. The purpose of the update is to communicate a potential area of concern for drought expansion and/or development within the Intermountain West based on recent conditions and the upcoming forecast. NIDIS and its partners will issue future drought status updates as conditions evolve.