Water Year 2024 Brought Record-Breaking Temperatures and Varied Precipitation to the Intermountain West, Leading to a Mix of Drought Degradation and Improvement
Key Points
- Water Year 2024 overall was warmer than normal across the Intermountain West, with variable precipitation across the region, contributing to drought development in Wyoming and limiting drought amelioration in southern New Mexico.
- Drier-than normal-conditions were noted in northwestern Arizona, southern New Mexico, western and southwestern Utah, north-central and southeastern Colorado, and eastern and southern Wyoming.
- Wetter-than-normal conditions were logged in northern portions of New Mexico, much of the southern Rockies of Colorado, areas of central and west-central Utah, and parts of northwestern Wyoming.
- Overall, the 2024 North American Monsoon season precipitation underperformed in Arizona and southern/western New Mexico and overperformed in eastern and northern Utah, northern New Mexico, and all but the Front Range and eastern Rockies of Colorado.
- As of October 7, 2024, El Niño-Southern Oscillation (ENSO) neutral conditions are expected to transition to La Niña by November (71% chance), which typically increases likelihood of drier winter conditions across the Southwest, and is expected to persist through January–March 2025.
This map shows drought conditions across the Intermountain West at the end of Water Year 2024.
The U.S. Drought Monitor depicts the location and intensity of drought across the country. The map uses 5 classifications: Abnormally Dry (D0), showing areas that may be going into or are coming out of drought, and four levels of drought (D1–D4).
The U.S. Drought Monitor is a joint effort of the National Oceanic and Atmospheric Administration, U.S. Department of Agriculture, and National Drought Mitigation Center.
This map shows drought conditions across the Intermountain West at the beginning of Water Year 2024.
The U.S. Drought Monitor depicts the location and intensity of drought across the country. The map uses 5 classifications: Abnormally Dry (D0), showing areas that may be going into or are coming out of drought, and four levels of drought (D1–D4).
The U.S. Drought Monitor is a joint effort of the National Oceanic and Atmospheric Administration, U.S. Department of Agriculture, and National Drought Mitigation Center.
U.S. Drought Monitor Categories
D0 - Abnormally Dry
Abnormally Dry (D0) indicates a region that is going into or coming out of drought. View typical impacts by state.
D1 - Moderate Drought
Moderate Drought (D1) is the first of four drought categories (D1–D4), according to the U.S. Drought Monitor. View typical impacts by state.
D2 - Severe Drought
Severe Drought (D2) is the second of four drought categories (D1–D4), according to the U.S. Drought Monitor. View typical impacts by state.
D3 - Extreme Drought
Extreme Drought (D3) is the third of four drought categories (D1–D4), according to the U.S. Drought Monitor. View typical impacts by state.
D4 - Exceptional Drought
Exceptional Drought (D4) is the most intense drought category, according to the U.S. Drought Monitor. View typical impacts by state.
Total Area in Drought (D1–D4)
Percent area of the Intermountain West Drought Early Warning System that is currently in drought (D1–D4), according to the U.S. Drought Monitor.
This map shows drought conditions across the Intermountain West at the end of Water Year 2024.
The U.S. Drought Monitor depicts the location and intensity of drought across the country. The map uses 5 classifications: Abnormally Dry (D0), showing areas that may be going into or are coming out of drought, and four levels of drought (D1–D4).
The U.S. Drought Monitor is a joint effort of the National Oceanic and Atmospheric Administration, U.S. Department of Agriculture, and National Drought Mitigation Center.
This map shows drought conditions across the Intermountain West at the beginning of Water Year 2024.
The U.S. Drought Monitor depicts the location and intensity of drought across the country. The map uses 5 classifications: Abnormally Dry (D0), showing areas that may be going into or are coming out of drought, and four levels of drought (D1–D4).
The U.S. Drought Monitor is a joint effort of the National Oceanic and Atmospheric Administration, U.S. Department of Agriculture, and National Drought Mitigation Center.
This U.S. Drought Monitor is released every Thursday morning, with data valid through Tuesday at 7 a.m. ET.
This U.S. Drought Monitor is released every Thursday morning, with data valid through Tuesday at 7 a.m. ET.
Jump to:
- Water Year 2024 Summary
- Water Year 2024 Drought Impacts
- What Is the North American Monsoon?
- How Did the 2024 Monsoon Impact Drought in the Intermountain West?
- Did ENSO-Neutral Conditions Impact the Monsoon?
- Looking Ahead
Intermountain West Water Year 2024 Summary
- Water Year 2024 (October 1, 2023–September 30, 2024) included a mixed bag of record-breaking temperatures, precipitation anomalies, and both drought development and improvement in the Intermountain West.
- Drought developed in Wyoming and improved in parts of New Mexico, Arizona, and Colorado. Long-term drought impacts remain in many areas of the region, including persistent drought in southern New Mexico, despite normal to above-normal precipitation in many areas.
- Roughly the same percentage of the Intermountain West was in drought at the start of Water Year 2024 (38.27%), as the start of Water Year 2025, October 1, 2024 (36.55%). However, drought conditions shifted across the region. At the onset of Water Year 2024, 94.86% of New Mexico was in Moderate to Exceptional Drought (D1–D4) and 0.0% of Wyoming was in drought. Drought has increased in Wyoming to 71.33% and improved in northern/central New Mexico (now covering only 34.73% of the state), eastern Arizona, and southwestern Colorado.
- Most of the Intermountain West experienced average- to above-average snowpack over the course of Water Year 2024. However, snow drought persisted throughout winter in much of northern Wyoming, with record-low snow water equivalent at several long-term SNOTEL stations.
- The 2024 North American Monsoon cumulatively delivered an underperforming season of precipitation for Arizona and southern/western New Mexico, while overperforming in eastern Utah, northern New Mexico, and all but the front range and eastern Rockies of Colorado, improving drought conditions in many areas.
- Colorado received 95% of normal precipitation for Water Year 2024, but areas were both much wetter than normal and much drier than normal. In Colorado, Monte Vista in the San Luis Valley recorded its wettest water year on record (since 1944) with 14.56 inches of precipitation.
- New Mexico statewide precipitation was 87% of average. Southern New Mexico was below average, and Las Cruces reported its driest water year on record with just 3.32 inches recorded.
- Utah experienced record rainfall totals in the southeast (parts of Emery, Wayne, and Garfield counties), which coincided with an eastern shift of the monsoon pattern.
- Above-normal temperatures impacted the entire Intermountain West region, which contributed to new drought development in Wyoming, Arizona, and eastern Colorado and long-term drought persistence in southern New Mexico.
- Arizona experienced its hottest summer (June–August) on record (130 years).
- Colorado experienced its 7th warmest water year on record, and its 5th warmest June–September. Grand Junction recorded its warmest summer on record, and eastern Colorado, including Kiowa, Bent, and Prowers Counties, continues to suffer from Severe Drought (D2).
- New Mexico had its 5th warmest water year and 3rd warmest summer (June–August) on record.
Figure 1: Intermountain West Water Year 2024 Drought Change Map: October 3, 2023–October 1, 2024
Key takeaway: In Water Year 2024, Wyoming experienced significant drought development, with a 3-4 category drought degradation (going from 0% of the state in drought to 71.33%). Much of New Mexico experienced notable drought recovery.
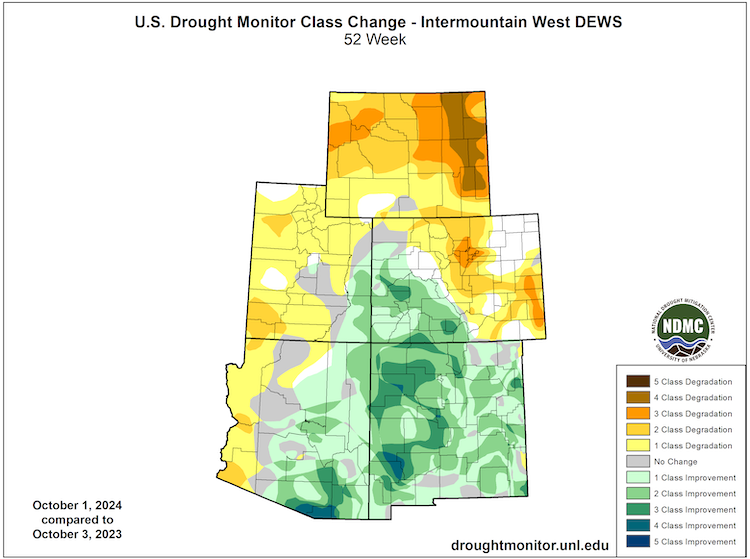
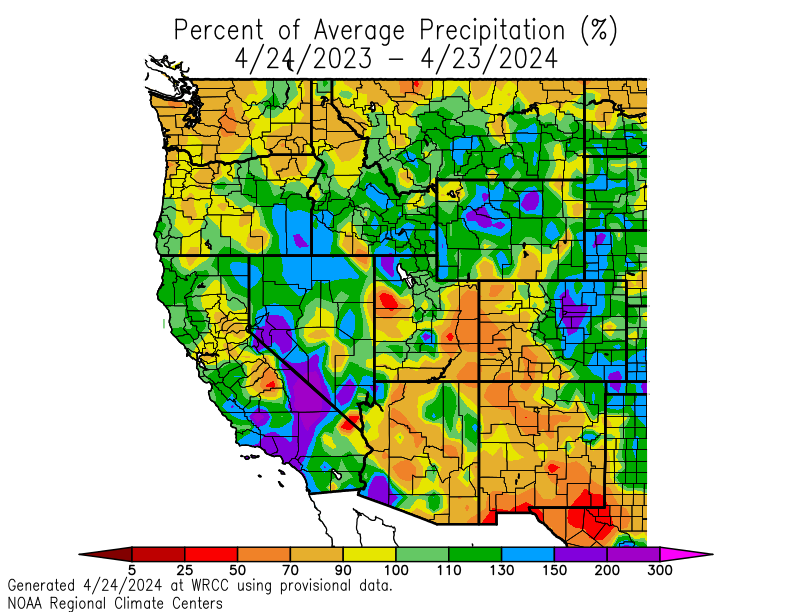
Figure 2: Percent of Average Precipitation: Water Year 2024
Key takeaway: Water Year 2024 was drier than normal across northwestern Arizona, southern New Mexico, western and southwestern Utah, north-central and southeastern Colorado, and eastern and southern Wyoming. Northern portions of New Mexico, much of the southern Rockies of Colorado, areas of central and west-central Utah, and parts of northwestern Wyoming saw wetter-than-normal conditions.
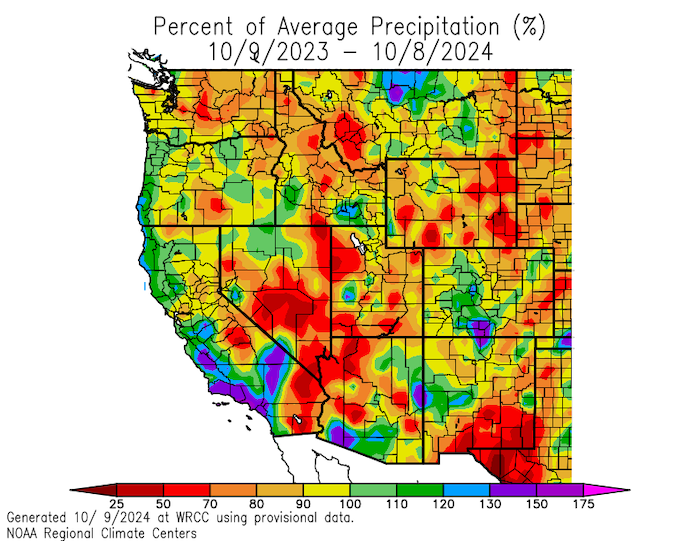
Figure 3: Water Year 2024 Mean Temperature Departure (°F) from Normal for the Western U.S.
Key takeaway: The entire Western U.S. experienced above- and much-above-normal mean temperatures this water year, with record warm temperatures in several locations across the region. In much of the Intermountain West, mean temperatures for the water year were between 1–4º F above normal.
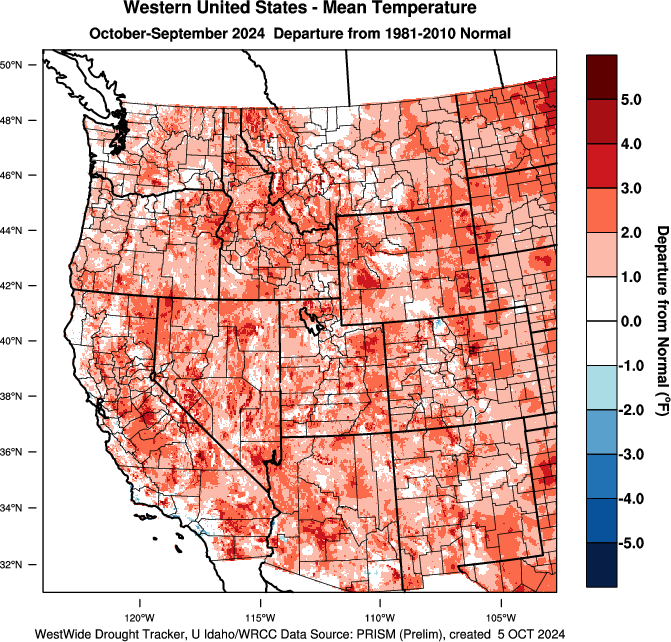
Figure 4: Summer 2024 Mean Temperature Rankings for the Western U.S.
Key takeaway: Summer 2024 saw record warm temperatures in many areas of Arizona, New Mexico, eastern Colorado, southwestern Utah, and southeastern Wyoming, compared to 1895–2010.
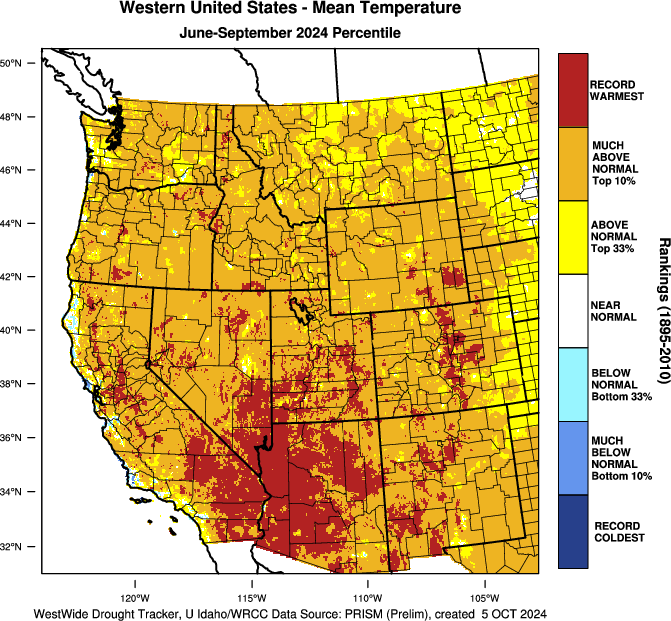
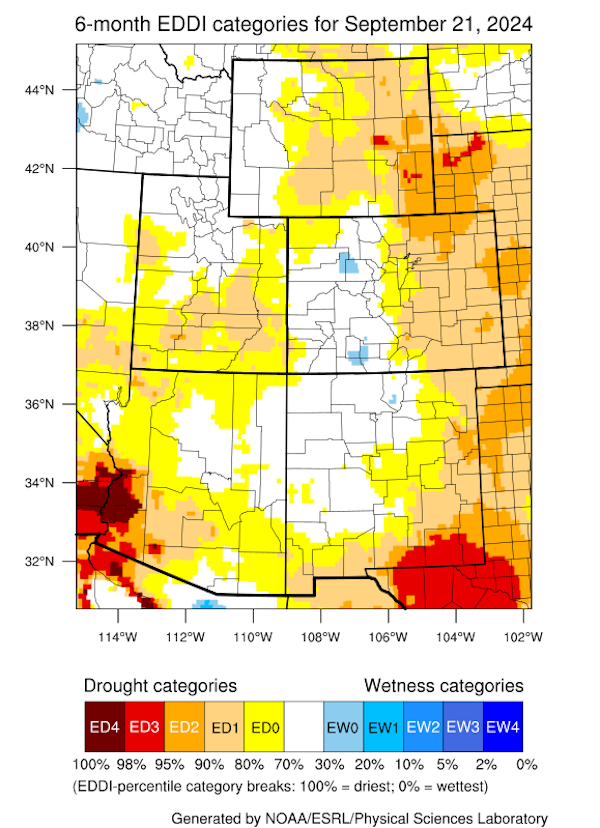
Figure 5: 6-Month Evaporative Demand Drought Index (EDDI): September 1, 2024
Key takeaway: Impacts of high spring and summer temperatures are evident in the Evaporative Demand Drought Index (EDDI), notably in southeastern Wyoming, southwestern Arizona, and southeastern New Mexico. Despite normal or above-normal precipitation, high evaporative demand (the “thirst” of the atmosphere) kept drought recovery to a minimum.
2024 Water Year Drought Impacts
- Wyoming degraded, from no drought a year ago to 71% of the state as of October 1, 2024. The worst agricultural impacts are in the northeastern corner of the state, where poor rangeland conditions, reduced crop yields, reduced irrigation water, water hauling for livestock, supplemental feeding, decreased stock weights, and dry creeks/stock ponds were reported.
- Central Utah and east-central and southern Colorado also reported agricultural and rangeland impacts with lack of forage production and dry soils impacting planting winter wheat requiring drilling into the ground in some fields.
- High temperatures affected water supply, irrigation, and hydropower generation. Warm temperatures reduced snowpack accumulation, produced an earlier snowmelt-driven run-off, and negatively impacted associated water management decisions for communities and land managers (e.g., agriculture, ranches, public lands) over the summer months.
- Lake Powell and Lake Mead maintain well-below-normal storage levels compared to long-term averages.
Drought impacted wildfire activity in Utah, Wyoming, and Arizona. Grassland growth in low elevations in Arizona was high due to wet conditions in winter 2024, which led to a 60% increase in acreage impacted by wildland fire, exacerbated by low summer precipitation in the lower desert areas.
Reservoir Levels Across the Intermountain West
- Over Water Year 2024, reservoir storage increased in Lake Powell, though it is still below average. Other reservoirs hit historic lows.
- As of June 2024, in the Upper Colorado River Basin, the U.S. Bureau of Reclamation reported reservoir levels for Flaming Gorge at 87% full, Blue Mesa at 63% full, and Navajo at 72% full. Lake Powell was 37% full. Unregulated inflow into Lake Powell for the April–July runoff period was approximately 5.32 million acre-feet (MAF), or 83% of average. As of October 4, 2024, Lake Powell was at 60.4% of average levels for this time of year.
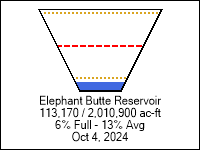
- After the irrigation season ended on the lower Rio Grande in New Mexico, Caballo Dam was shut off (September 28), and water releases from the Elephant Butte dam ended on September 26, 2024. Elephant Butte is currently 6% full (13.2% of average storage for this time of year).
Figure 6: October 2024 Reservoir Storage Levels
Key Takeaway: Lake Powell storage improved over the course of Water Year 2024, while Lake Mead (Colorado River) and Elephant Butte (Rio Grande) are both at historical lows.
Source: U.S. Bureau of Reclamation Reservoir Storage Dashboard. Data valid October 4, 2024.
What Is the North American Monsoon? Why Does It Matter?
The North American Monsoon is a seasonal circulation of subtropical moisture that develops over northern Mexico and extends into the Southwest U.S. from June 15–-September 30. Monsoonal surges can occur north and west of these "core" areas, reaching Nevada, southeastern California, and Wyoming, including the Greater Yellowstone Region. Monsoonal rainfall accounts for nearly 50% of the total annual precipitation across much of Arizona and New Mexico. Learn more about the North American Monsoon.
How Did the 2024 North American Monsoon Impact Drought in the Intermountain West?
- Pre-Monsoon Conditions:
- As of June 4, 2024, drought conditions were most severe in southern New Mexico, with areas experiencing drought in Arizona, Colorado, New Mexico, Utah, and Wyoming.
- Following a strong El Niño winter (with normal to above-normal snowpack for most of the region), a climate pattern that resembled the monsoon developed in June and July, caused by unusually high thunderstorm activity in the southwestern Atlantic Ocean, Caribbean, and Gulf of Mexico. This resulted in an increase in near-surface Gulf moisture and increased winds from the two jet streams, and facilitated better organization of thunderstorms (which were not a monsoon pattern).
- The August- September precipitation was a traditional North American Monsoon pattern (south to north steering flow similar to the 2016 monsoon), which brought average to above-average precipitation for some of the southwestern U.S., including the four corners region, areas of northern New Mexico, southeastern Arizona and southwestern Colorado.
- Prior to the 2024 Monsoon season, all five Intermountain West states were experiencing some level of drought. As of June 4, 2024 the U.S. Drought Monitor reported that 20.02% of Arizona, 72.41% of New Mexico, 12.89% of Colorado, 6.17% of Wyoming, and 0.40% of Utah were in drought.
- The highest monsoon seasonal precipitation totals were in northern New Mexico (between 90%-150% of normal) and the Four Corners region.
- State-by-State Summary:
- New Mexico: Monsoon precipitation was below normal in southern New Mexico (25% of normal monsoon precipitation) and the southwestern climate district (30th driest monsoon season). However, the northeastern climate district had its 29th wettest monsoon, which improved drought in some areas of New Mexico. Statewide precipitation in New Mexico ranked 65th driest between June-September.
- Arizona: Areas of western and central Arizona had an underperforming monsoon season. Phoenix experienced 30% of normal monsoon season precipitation, while Tucson was at 101% of normal precipitation.
- Colorado: Areas of southern and western Colorado received normal to above-normal precipitation. The eastern plains received below-normal precipitation.
- Utah: Statewide, Utah cumulatively experienced well-above normal rainfall. but July precipitation conditions were well-below average with several counties in east central Utah experiencing record dry rainfall totals, followed by record wet August precipitation. Though short-term drought conditions impacting agriculture and rural communities worsened, healthy soil moisture and reservoir levels demonstrate gradual hydrologic drought improvement.
- Wyoming: Wyoming was largely very dry through the 2024 Monsoon Season, outside of a wet August in the far southeast part of the state. Less than 50% of normal precipitation fell in parts of central and northeast Wyoming, leading to rapid expansion of drought. As of October 1, 2024, 71% of the state was in drought, with 12% of the state in Extreme Drought (D3).
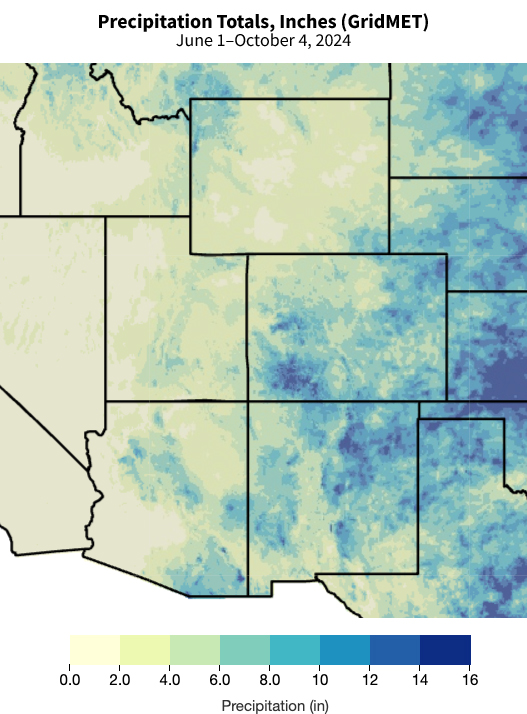
Figure 7: 2024 Monsoon Precipitation (June 1–October 4, 2024)
Key takeaway: Favorable monsoon seasonal precipitation fell in northern New Mexico, southeastern Arizona, and southwestern Colorado.
Did the El Niño–Southern Oscillation (ENSO) Neutral Conditions Impact the 2024 North American Monsoon?
The relationship between the monsoon and El Niño/La Niña events is hard to predict, though there is evidence of a correlation. Several physical mechanisms link wet winters in the monsoonal region during El Niño years with high spring soil moisture that delays the monsoonal onset. However, the extreme year-to-year variability inherent to monsoonal activity limits the statistical ability to anticipate ENSO conditions with summer precipitation outlooks, where seasonal conditions are often driven primarily by event-level weather patterns.
- Winter 2023–2024’s El Niño conditions brought normal to above-normal snowpack for much of the region, including Utah, Colorado, and northern New Mexico.
- Some research suggests summers with La Niña conditions tend to favor robust monsoon activity in June and July, and summers with El Niño conditions tend to favor less active monsoons, but wetter winter precipitation.
- Summer and early fall 2024 were ENSO-neutral. ENSO-neutral conditions can result in strong or weak monsoon precipitation for the Southwest and Four Corners areas.
Looking Ahead
- NOAA’s ENSO alert system is currently reporting ENSO-neutral conditions with La Niña favored to emerge in September–November (71% chance) and expected to persist through January–March 2025. For more information, check out the NOAA ENSO blog and current status presentation. Explore this more for your region of interest with the Western Regional Climate Center ENSO Precipitation Tool.
- If the potential La Niña extends into the winter, it will likely favor drier conditions in the Southwest over the winter months.
- Odds favor below-normal precipitation for October–December 2024, while temperatures are more likely to be above normal, increasing chances for drought degradation in the region.
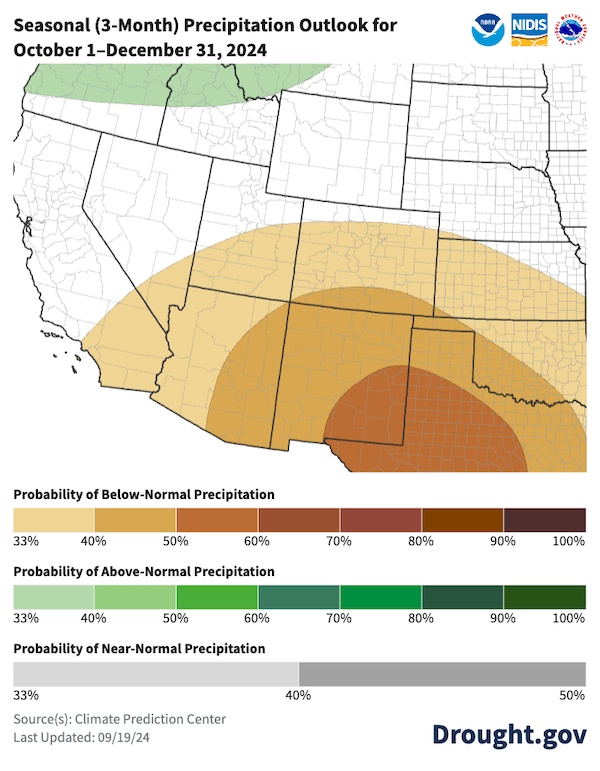
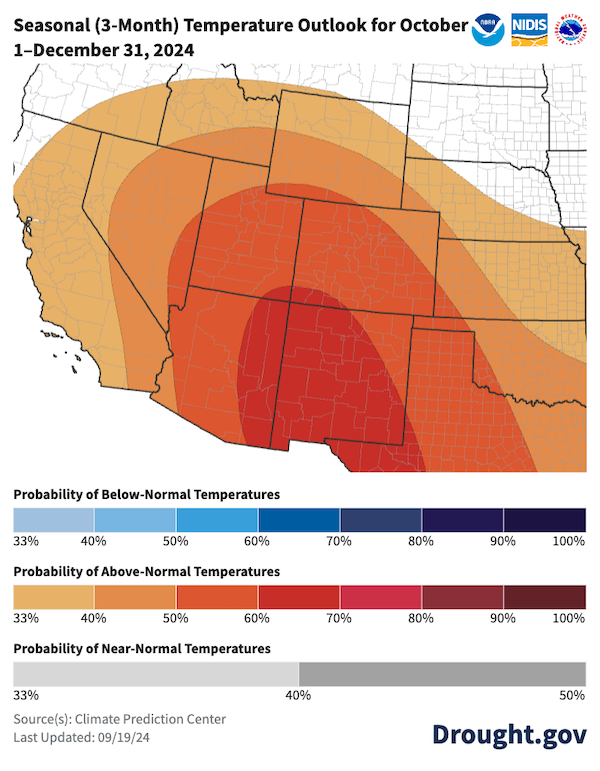
Figure 8: Seasonal Precipitation and Temperature Outlooks (October–December 2024)
Key takeaway: According to NOAA’s Climate Prediction Center, odds favor both below-average precipitation and above-average temperatures across the Intermountain West, southern California, and southern Nevada from October–December 2024.
Additional Resources
- Local NOAA National Weather Service (NWS) pages:
- Climate Assessment for the Southwest (a NOAA CAP/RISA team)
Prepared By
Gretel Follingstad, Amanda Sheffield, Kelsey Satalino, Eleanor Hasenbeck
CU Boulder/Cooperative Institute for Research in Environmental Sciences (CIRES), NOAA/National Integrated Drought Information System (NIDIS)
Dave Simeral
Western Regional Climate Center/Desert Research Institute
Erinanne Saffell
Arizona State Climate Office
Peter Goble
Colorado Climate Center
Jon Meyer
Utah Climate Center
Michael Natoli, Andrew Mangham
NOAA’s National Weather Service
Paul Miller
NOAA’s National Water Prediction Service Colorado River Basin Forecast Center
Mike Crimmins
Arizona State University
Dave DuBois
New Mexico State Climatologist, New Mexico State University
Laura Haskell
Utah Department of Natural Resources
This drought status update was issued in partnership between the National Oceanic and Atmospheric Administration (NOAA)/National Integrated Drought Information System (NIDIS) and partners across the Intermountain West. The purpose of the update is to communicate current conditions, outlooks, and the impacts of the 2024 North American Monsoon Season. NIDIS and its partners will issue future drought status updates as conditions evolve.

