Expanded Drought.gov Tool Visualizes Historical Drought Conditions by County, State
The "Dust Bowl" drought of the 1930s brought nearly a decade of dry conditions to the Great Plains, causing many farmers to flee their lands and livelihoods. Looking further back, tree-ring and lake-sediment records indicate that "megadroughts" have occurred in North America over the last thousand years. By looking back at historical data, communities can get a better understanding of how current droughts compare to past events and drought and extreme weather threats to be prepared for.
The U.S. Drought Portal’s Historical Data and Conditions Tool allows users to visualize historical drought data for their state or county through an interactive map and time series graph. Recently, NOAA’s National Integrated Drought Information System (NIDIS) partnered with NOAA’s National Centers for Environmental Information (NCEI) to expand and improve this interactive tool—making it easier to visualize and share historical data for use in communications, research, or decision-making.
NIDIS hopes that this tool will make historical drought data more accessible and easier to share, whether you’re communicating drought updates in a newsletter or social media, updating a drought plan for your region, or making decisions for your business.
About the Data
The updated tool allows users to explore three historical drought datasets, with different data sources and periods of record:
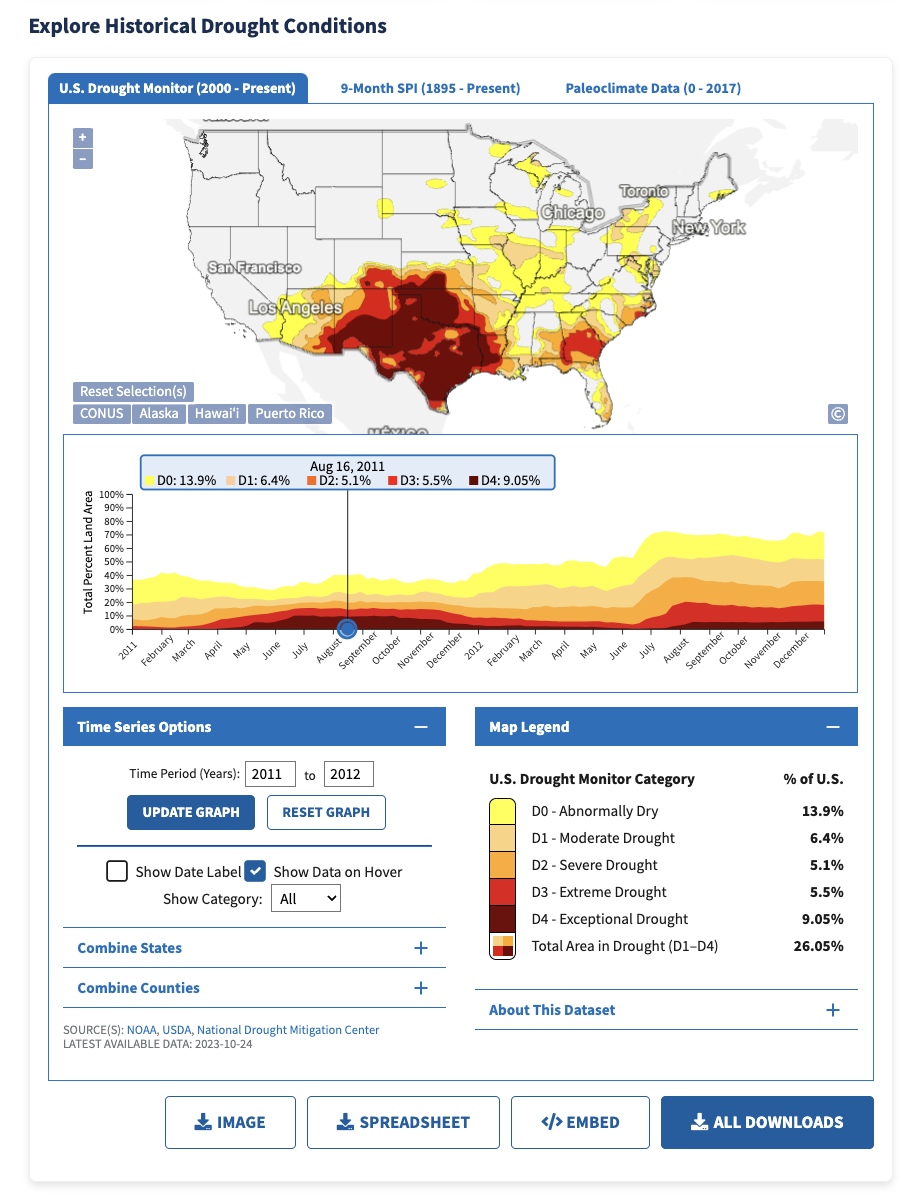
2000–Present: The U.S. Drought Monitor
The U.S. Drought Monitor is a weekly map that depicts the location and intensity of drought across the country. It is jointly produced by the National Oceanic and Atmospheric Administration, U.S. Department of Agriculture, and National Drought Mitigation Center.
Pros: Drought Monitor authors rotate creating the map each week using a “convergence of evidence” approach based on their assessments of the best available data and input from local observers.
Cons: The data only go back to 2000.
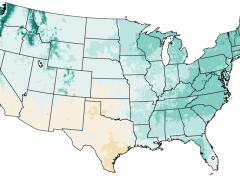
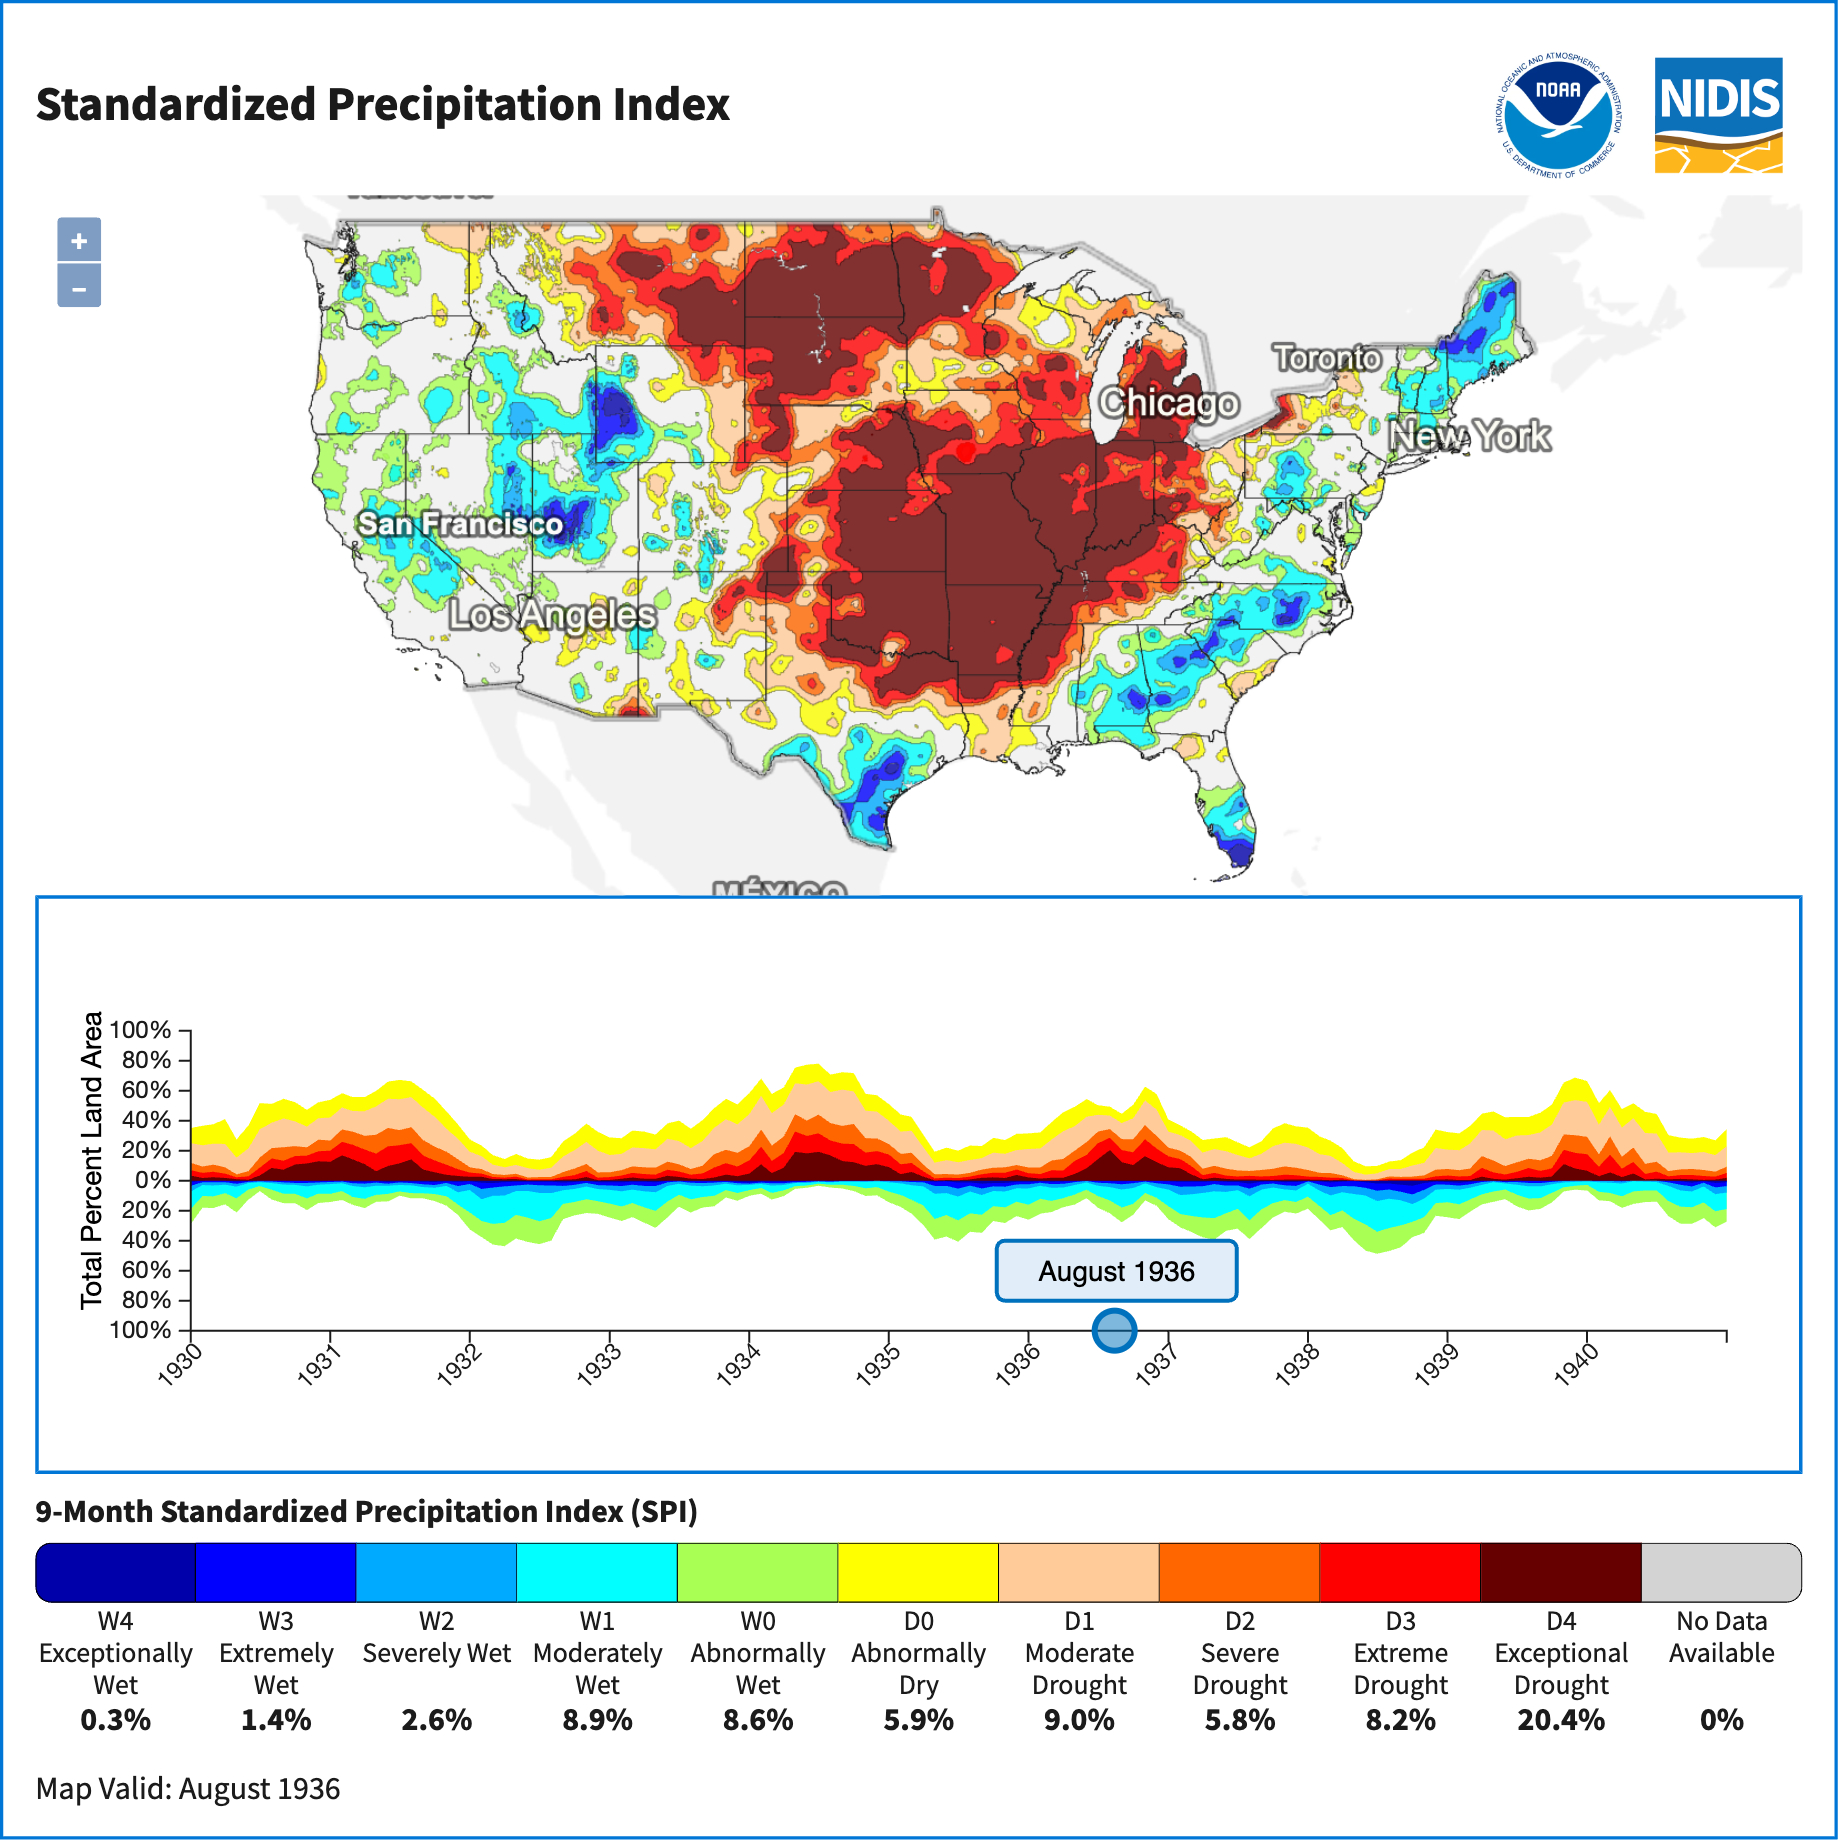
1895–Present: 9-Month Standardized Precipitation Index (SPI)
Drought results from an imbalance between water supply and water demand. The Standardized Precipitation Index (or SPI) is a drought index that captures how observed precipitation (rain, hail, snow) deviates from the climatological average over a given time period—in this case, the 9 months leading up to the selected date.
Pros: This SPI from NOAA/NCEI has a longer period of record and is based on station data that goes back to 1895.
Cons: While SPI measures precipitation, it does not include measures of temperature, evaporative demand, or other drought-related indicators.
0–2017: Palmer Modified Drought Index
This paleoclimate dataset from NCEI combines tree-ring reconstructions with instrumental data to estimate drought conditions each summer (June–August) going back to the year 0 for some regions.
Pros: Proxy paleoclimate data can help us estimate past climate conditions far into the past.
Cons: These estimates come with greater uncertainty than our modern instrumental records, this dataset only goes up to 2017.
New Historical Tool Features
NIDIS and NCEI have updated the Historical Data & Conditions Tool based on usability testing and user feedback. These improvements include:
- Better controls to view data for customized regions. View maps, time series graphs, and statistics for a custom combination of states or counties. Users can easily add or remove regions in the “Combine States” and “Combine Counties” sections, or use Shift+Click to select multiple regions right on the interactive map.
- Hoverable statistics to easily compare drought conditions over time. Hover over any point on the time series graph to see the percent land area in dry or wet conditions, according to that historical dataset. Or, click on a point on the graph to update the map and legend statistics.
- Improved image and data downloads. Download a high-quality PNG image of the customized map, timeseries, or both for easy sharing. You can also download the historical data for the region, time period, and dataset you’ve selected as a CSV, XML, or JSON file.
- Interactive legends with drought statistics. Hover over the legend for the dataset you’ve selected to learn more about each “dry” or “wet” percentile category. Or view the “About This Dataset” section to learn more about the historical drought index you’ve selected.
- More time series customization options. In addition to the ability to zoom in a particular time period, users can also choose to show or hide a date label for the selected date, or isolate only specific percentile categories.
To use the Historical Data & Conditions Tool, go to Data & Maps in the main Drought.gov menu, then click “Historical Information.” Or visit www.drought.gov/historical-information.
Questions or feedback? We’d love to hear from you! Reach out to the U.S. Drought Portal team at drought.portal@noaa.gov.