Water Balance and Evapotranspiration Spatial Maps - Now Available!
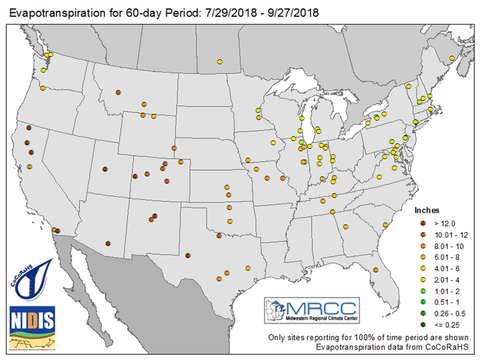
A crucial part of monitoring weather is measuring the amount of water from the atmosphere that falls to the ground as precipitation. However, it is equally important to know how much water is leaving the soil and returning to the atmosphere. Evapotranspiration (ET) measures the amount of water that evaporates from the ground back into the atmosphere - as transpiration from vegetation and as direct evaporation from open water and soil. It is important to measure ET for agriculture, lawn care, weather prediction, hydrology, and much more.
However, ET data is relatively sparse across the United States. This gap in data was recognized by the citizen science Community Collaborative Rain, Hail, and Snow (CoCoRaHS) network, which started encouraging their volunteer observers to measure evapotranspiration during the freeze-free season (generally May through October), in addition to their typical precipitation measurements. CoCoRaHS provides volunteer observers’ measurements of ET through their website - www.cocorahs.org.
With CoCoRaHS providing both precipitation and ET measurements, it is possible to compute the water balance, which is the difference between the precipitation accumulated in a certain time period and the total evapotranspiration through the same time period.
At the Midwest Drought Early Warning System (DEWS) regional workshops in fall 2016, workshop attendees noted that although ET and water balance data is available through CoCoRaHS, it is only available by looking at individual stations. The Midwest DEWS stakeholders stated that a spatial map of the region and/or the United States with ET and water balance data would be very helpful for decision making and situational awareness. The Midwestern Regional Climate Center (MRCC) responded to this identified information gap, and in collaboration with NIDIS and CoCoRaHS, now offers spatial maps that show the ET and water balance data for the contiguous United States, as well as the Midwest region.
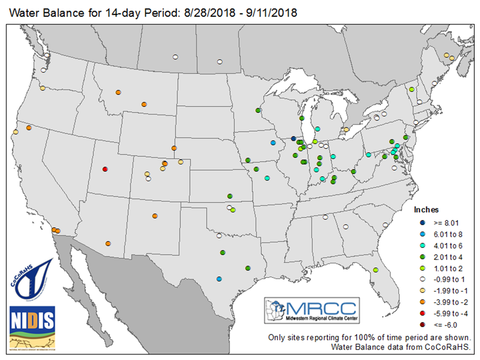
The MRCC’s Midwest Climate Watch Drought page provides ET maps for 1-day, 7-day, 14-day, 30-day, and 60-day totals. Water balance maps are provided for 7-day, 14-day, 30-day, and 60-day totals. The maps are available only in the freeze-free season (generally May-October), since that is when ET measurements are taken by CoCoRaHS observers.
If you want to become a CoCoRaHS observer for measuring precipitation, snowfall, evapotranspiration, or other important atmospheric variables - please visit CoCoRaHS!