U.S. flag

An official website of the United States government

NEWS ARCHIVE

Browse news articles

Published Date Between
Search Results(154)
Published on

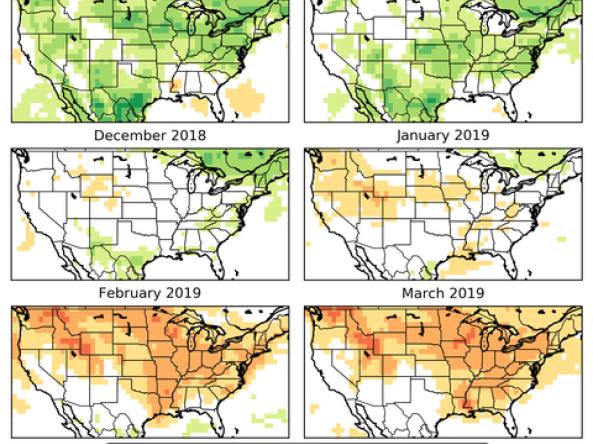
As of November 15, 2018, the snow drought page is live for the 2018–2019 winter season. Regular updates will be posted every month in November and December, and every two weeks through spring and early summer. The snow drought page features an overview of current conditions across the country as well as a number of snow drought monitoring tools that can help decision makers and resource managers monitor, plan for, and cope with snow drought and its impacts.

Published on

The Evaporative Demand Drought Index, also known as EDDI, is an experimental drought monitoring and early warning tool that looks for drought using atmospheric evaporative demand (also known as the “thirst of the atmosphere”). So far, EDDI maps and data have been made available for near-real-time and historical monitoring; now, with the help of the NOAA NCEI, EDDI and evaporative demand probability forecast maps are now available via NCEI’s Drought Termination and Amelioration tool.

Published on

The NIDIS Drought and Wildland Fire Nexus (NDAWN) is a strategic, decision-support information network that responds to the needs and challenges of fire managers for effectively utilizing drought information. Through a partnership with the Western Regional Climate Center and the Desert Research Institute, and in consultation with the fire management community, NIDIS recently co-produced a four-year NDAWN Strategic Plan. This plan outlines the complicated relationship between drought and wildland fire behavior, how this relationship affects wildland fire response and management, and the gaps in research and operations that would improve the wildland fire community’s use and understanding of drought information in fire management to improve firefighter and public safety.

Published on

NIDIS, in partnership with the Mississippi River Cities and Towns Initiative, the USDA Office of the Chief Economist, NOAA’s Office of the Chief Economist, the cross-agency National Drought Resilience Partnership, and other governmental and sectoral partners, are joining forces to study and quantify drought impacts to the trade footprint along the Mississippi River Corridor in the following industries: agricultural production; commercial river navigation and transportation; manufacturing, including off-farm manufacturing; and recreation and tourism.

Published on

The Midwest Regional Climate Center’s Midwest Climate Watch Drought page provides evapotranspiration (ET) maps for 1-day, 7-day, 14-day, 30-day, and 60-day totals. Water balance maps are provided for 7-day, 14-day, 30-day, and 60-day totals. The maps are available only in the freeze-free season (generally May–October).

Published on

On September 11th and 12th, NIDIS and NOAA’s NCEI held the 3rd annual Drought Amelioration Workshop in Phoenix, Arizona: “The Burning Desert: A Workshop on Drought Recovery Tools and Perspectives.” Representatives from Arizona, Colorado, Nevada, New Mexico, and Utah met in Phoenix to discuss the challenges of drought and water management in the West, and to evaluate selected resources available to help decision makers plan for and respond to drought.

Published on

Dry Times—formerly a bi-annual printed newsletter—has been converted into a more streamlined, email-based newsletter in an effort to establish and maintain regular and consistent communication with its partners and stakeholders in the regional Drought Early Warning Information Systems and around the country. 

Published on

The Physical Sciences Division of the NOAA Earth System Research Laboratory, in partnership with NIDIS, is conducting a year-long study examining the 2017 Northern Plains Drought. The study is examining the causes, evolution, and predictability of last year’s drought across much of Montana and the Dakotas, evaluating the historical behavior of droughts over this region, and determining what role, if any, climate change may have played.

Published on

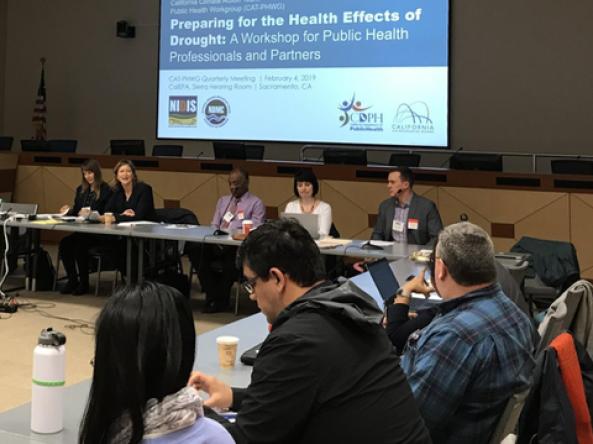
Recently, the CDC National Center for Environmental Health released a guide called Preparing for the Health Effects of Drought: A Resource Guide for Public Health Professionals. This new guide contains five modules, providing best practices on conducting vulnerability assessments, collaboration among stakeholders, communicating drought preparedness and response strategies, and where to find (and how to use) data on drought. 

Published on

Now is a good time to revisit a Story Map developed by NIDIS and NOAA Climate Office’s Modeling, Analysis, Predictions and Projections program. This story map is an interactive presentation that analyzes and explains the 2010–2015 Texas drought, taking users through a visual history of the drought using images and graphs to provide an interactive and engaging experience.