CPC Temperature and Precipitation Outlooks
NOAA / National Weather Service / National Centers for Environmental Prediction / Climate Prediction Center (CPC)
The National Weather Service's Climate Prediction Center (CPC) produces temperature and precipitation outlooks for the U.S., including 6–10 day, 8-14 day, 1-month, and seasonal (3-month) outlooks.
Using the climatology period 1991–2020, the 6–10 day and 8–14 day outlooks depict whether the probability (percent chance) of above-normal, below-normal, or near-normal conditions during the noted time frame. The monthly and seasonal outlooks depict the probability (percent chance) of above-or below-normal conditions.
The colored shading on the map indicates the degree of confidence the forecaster has in the category indicated. The darker the shading, the greater is the level of confidence. For temperature outlooks, blue hues indicate "below-normal" and orange-red hues indicate "above normal." For precipitation outlooks, brown hues indicate "below-normal" and green hues indicate "above normal."
This map shows the probability (percent chance) of above-normal, near-normal, or below-normal precipitation 8 to 14 days in the future.
This map shows the probability (percent chance) of above-normal (green hues) or below-normal (brown hues) precipitation over the next calendar month. White areas indicates equal chances of above- or below-normal precipitation.
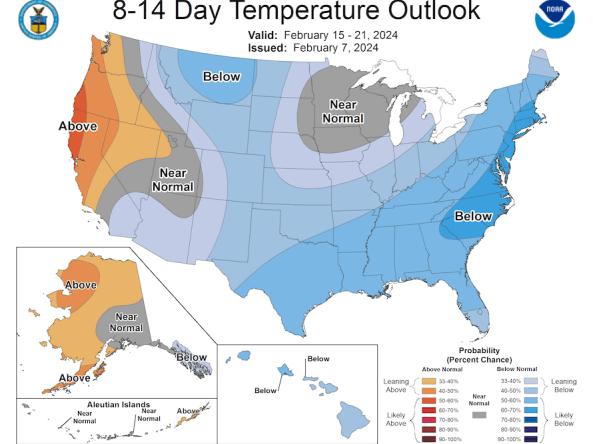
This map shows the probability (percent chance) of above-normal, near-normal, or below-normal temperature 8 to 14 days in the future.
This map shows the probability (percent chance) of above-normal (red hues) or below-normal (blue hues) temperatures over the next calendar month. White areas indicates equal chances of above- or below-normal temperatures.
Drought is defined as the lack of precipitation over an extended period of time, usually for a season or more, that results in a water shortage. Changes in precipitation can substantially disrupt crops and livestock, influence the frequency and intensity of severe weather events, and affect the quality and quantity of water available for municipal and industrial use.
Learn MoreFlash drought is the rapid onset or intensification of drought. Unlike slow-evolving drought, which is caused by a decline in precipitation, flash drought occurs when low precipitation is accompanied by abnormally high temperatures, high winds, and/or changes in radiation. These sometimes-rapid changes can quickly raise evapotranspiration rates and remove available water from the landscape.
Learn MorePeriods of drought can lead to inadequate water supply, threatening the health, safety, and welfare of communities. Streamflow, groundwater, reservoir, and snowpack data are key to monitoring and forecasting water supply.
Learn MoreDrought can reduce the water availability and water quality necessary for productive farms, ranches, and grazing lands, resulting in significant negative direct and indirect economic impacts to the agricultural sector. Monitoring agricultural drought typically focuses on examining levels of precipitation, evaporative demand, soil moisture, and surface/groundwater quantity and quality.
Learn MoreDrought is defined as the lack of precipitation over an extended period of time, usually for a season or more, that results in a water shortage. Changes in precipitation can substantially disrupt crops and livestock, influence the frequency and intensity of severe weather events, and affect the quality and quantity of water available for municipal and industrial use.
Learn MoreSnow drought is a period of abnormally low snowpack for the time of year. Snowpack typically acts as a natural reservoir, providing water throughout the drier summer months. Lack of snowpack storage, or a shift in timing of snowmelt, can be a challenge for drought planning.
Learn MorePeriods of drought can lead to inadequate water supply, threatening the health, safety, and welfare of communities. Streamflow, groundwater, reservoir, and snowpack data are key to monitoring and forecasting water supply.
Learn MoreDrought can reduce the water availability and water quality necessary for productive farms, ranches, and grazing lands, resulting in significant negative direct and indirect economic impacts to the agricultural sector. Monitoring agricultural drought typically focuses on examining levels of precipitation, evaporative demand, soil moisture, and surface/groundwater quantity and quality.
Learn MoreAir temperature can have wide-ranging effects on natural processes. Warmer air temperatures increase evapotranspiration—which is the combination of evaporation from the soil and bodies of water and transpiration from plants—and lower soil moisture.
Learn MoreFlash drought is the rapid onset or intensification of drought. Unlike slow-evolving drought, which is caused by a decline in precipitation, flash drought occurs when low precipitation is accompanied by abnormally high temperatures, high winds, and/or changes in radiation. These sometimes-rapid changes can quickly raise evapotranspiration rates and remove available water from the landscape.
Learn MoreAir temperature can have wide-ranging effects on natural processes. Warmer air temperatures increase evapotranspiration—which is the combination of evaporation from the soil and bodies of water and transpiration from plants—and lower soil moisture.
Learn MoreSnow drought is a period of abnormally low snowpack for the time of year. Snowpack typically acts as a natural reservoir, providing water throughout the drier summer months. Lack of snowpack storage, or a shift in timing of snowmelt, can be a challenge for drought planning.
Learn MoreDrought can reduce the water availability and water quality necessary for productive farms, ranches, and grazing lands, resulting in significant negative direct and indirect economic impacts to the agricultural sector. Monitoring agricultural drought typically focuses on examining levels of precipitation, evaporative demand, soil moisture, and surface/groundwater quantity and quality.
Learn MoreProbability of Below-Normal Precipitation
33%–40% Chance of Below Normal
There is an 33%–40% chance of below-normal precipitation during this period.
40%–50% Chance of Below Normal
There is an 40%–50% chance of below-normal precipitation during this period.
50%–60% Chance of Below Normal
There is an 50%–60% chance of below-normal precipitation during this period.
60%–70% Chance of Below Normal
There is an 60%–70% chance of below-normal precipitation during this period.
70%–80% Chance of Below Normal
There is an 70%–80% chance of below-normal precipitation during this period.
80%–90% Chance of Below Normal
There is an 80%–90% chance of below-normal precipitation during this period.
>90% Chance of Below Normal
There is a >90% chance of below-normal precipitation during this period.
Probability of Above-Normal Precipitation
33%–40% Chance of Above Normal
There is an 33%–40% chance of above-normal precipitation during this period.
40%–50% Chance of Above Normal
There is an 40%–50% chance of above-normal precipitation during this period.
50%–60% Chance of Above Normal
There is an 50%–60% chance of above-normal precipitation during this period.
60%–70% Chance of Above Normal
There is an 60%–70% chance of above-normal precipitation during this period.
70%–80% Chance of Above Normal
There is an 70%–80% chance of above-normal precipitation during this period.
80%–90% Chance of Above Normal
There is an 80%–90% chance of above-normal precipitation during this period.
>90% Chance of Above Normal
There is a >90% chance of above-normal precipitation during this period.
Near-Normal
Odds favor near-normal precipitation during this period.
Probability of Below-Normal Precipitation
33%–40% Chance of Below Normal
There is an 33%–40% chance of below-normal precipitation during this period.
40%–50% Chance of Below Normal
There is an 40%–50% chance of below-normal precipitation during this period.
50%–60% Chance of Below Normal
There is an 50%–60% chance of below-normal precipitation during this period.
60%–70% Chance of Below Normal
There is an 60%–70% chance of below-normal precipitation during this period.
70%–80% Chance of Below Normal
There is an 70%–80% chance of below-normal precipitation during this period.
80%–90% Chance of Below Normal
There is an 80%–90% chance of below-normal precipitation during this period.
>90% Chance of Below Normal
There is a >90% chance of below-normal precipitation during this period.
Probability of Above-Normal Precipitation
33%–40% Chance of Above Normal
There is an 33%–40% chance of above-normal precipitation during this period.
40%–50% Chance of Above Normal
There is an 40%–50% chance of above-normal precipitation during this period.
50%–60% Chance of Above Normal
There is an 50%–60% chance of above-normal precipitation during this period.
60%–70% Chance of Above Normal
There is an 60%–70% chance of above-normal precipitation during this period.
70%–80% Chance of Above Normal
There is an 70%–80% chance of above-normal precipitation during this period.
80%–90% Chance of Above Normal
There is an 80%–90% chance of above-normal precipitation during this period.
>90% Chance of Above Normal
There is a >90% chance of above-normal precipitation during this period.
Probability of Near-Normal Precipitation
33%–40% of Near Normal
There is an 33%–40% chance of near-normal precipitation during this period.
40%–50% of Near Normal
There is an 40%–50% chance of near-normal precipitation during this period.
Probability of Below-Normal Temperatures
33%–40% Chance of Below Normal
There is an 33%–40% chance of below-normal temperatures during this period.
40%–50% Chance of Below Normal
There is an 40%–50% chance of below-normal temperatures during this period.
50%–60% Chance of Below Normal
There is an 50%–60% chance of below-normal temperatures during this period.
60%–70% Chance of Below Normal
There is an 60%–70% chance of below-normal temperatures during this period.
70%–80% Chance of Below Normal
There is an 70%–80% chance of below-normal temperatures during this period.
80%–90% Chance of Below Normal
There is an 80%–90% chance of below-normal temperatures during this period.
>90% Chance of Below Normal
There is a >90% chance of below-normal temperatures during this period.
Probability of Above-Normal Temperatures
33%–40% Chance of Above Normal
There is an 33%–40% chance of above-normal temperatures during this period.
40%–50% Chance of Above Normal
There is an 40%–50% chance of above-normal temperatures during this period.
50%–60% Chance of Above Normal
There is an 50%–60% chance of above-normal temperatures during this period.
60%–70% Chance of Above Normal
There is an 60%–70% chance of above-normal temperatures during this period.
70%–80% Chance of Above Normal
There is an 70%–80% chance of above-normal temperatures during this period.
80%–90% Chance of Above Normal
There is an 80%–90% chance of above-normal temperatures during this period.
>90% Chance of Above Normal
There is a >90% chance of above-normal temperatures during this period.
Near-Normal
Odds favor near-normal temperatures during this period.
Probability of Below-Normal Temperatures
33%–40% Chance of Below Normal
There is an 33%–40% chance of below-normal temperatures during this period.
40%–50% Chance of Below Normal
There is an 40%–50% chance of below-normal temperatures during this period.
50%–60% Chance of Below Normal
There is an 50%–60% chance of below-normal temperatures during this period.
60%–70% Chance of Below Normal
There is an 60%–70% chance of below-normal temperatures during this period.
70%–80% Chance of Below Normal
There is an 70%–80% chance of below-normal temperatures during this period.
80%–90% Chance of Below Normal
There is an 80%–90% chance of below-normal temperatures during this period.
>90% Chance of Below Normal
There is a >90% chance of below-normal temperatures during this period.
Probability of Above-Normal Temperatures
33%–40% Chance of Above Normal
There is an 33%–40% chance of above-normal temperatures during this period.
40%–50% Chance of Above Normal
There is an 40%–50% chance of above-normal temperatures during this period.
50%–60% Chance of Above Normal
There is an 50%–60% chance of above-normal temperatures during this period.
60%–70% Chance of Above Normal
There is an 60%–70% chance of above-normal temperatures during this period.
70%–80% Chance of Above Normal
There is an 70%–80% chance of above-normal temperatures during this period.
80%–90% Chance of Above Normal
There is an 80%–90% chance of above-normal temperatures during this period.
>90% Chance of Above Normal
There is a >90% chance of above-normal temperatures during this period.
Probability of Near-Normal Temperatures
33%–40% of Near Normal
There is an 33%–40% chance of near-normal temperatures during this period.
40%–50% of Near Normal
There is an 40%–50% chance of near-normal temperatures during this period.
This map shows the probability (percent chance) of above-normal, near-normal, or below-normal precipitation 8 to 14 days in the future.
This map shows the probability (percent chance) of above-normal (green hues) or below-normal (brown hues) precipitation over the next calendar month. White areas indicates equal chances of above- or below-normal precipitation.
This map shows the probability (percent chance) of above-normal, near-normal, or below-normal temperature 8 to 14 days in the future.
This map shows the probability (percent chance) of above-normal (red hues) or below-normal (blue hues) temperatures over the next calendar month. White areas indicates equal chances of above- or below-normal temperatures.
The Climate Prediction Center updates their 8–14 day outlooks daily.
The Climate Prediction Center updates their monthly precipitation outlook on the third Thursday of each calendar month and again on the last day of each calendar month.
The Climate Prediction Center updates their 8–14 day outlooks daily.
The Climate Prediction Center updates their monthly temperature outlook on the third Thursday of each calendar month and again on the last day of each calendar month.
Drought is defined as the lack of precipitation over an extended period of time, usually for a season or more, that results in a water shortage. Changes in precipitation can substantially disrupt crops and livestock, influence the frequency and intensity of severe weather events, and affect the quality and quantity of water available for municipal and industrial use.
Learn MoreFlash drought is the rapid onset or intensification of drought. Unlike slow-evolving drought, which is caused by a decline in precipitation, flash drought occurs when low precipitation is accompanied by abnormally high temperatures, high winds, and/or changes in radiation. These sometimes-rapid changes can quickly raise evapotranspiration rates and remove available water from the landscape.
Learn MorePeriods of drought can lead to inadequate water supply, threatening the health, safety, and welfare of communities. Streamflow, groundwater, reservoir, and snowpack data are key to monitoring and forecasting water supply.
Learn MoreDrought can reduce the water availability and water quality necessary for productive farms, ranches, and grazing lands, resulting in significant negative direct and indirect economic impacts to the agricultural sector. Monitoring agricultural drought typically focuses on examining levels of precipitation, evaporative demand, soil moisture, and surface/groundwater quantity and quality.
Learn MoreDrought is defined as the lack of precipitation over an extended period of time, usually for a season or more, that results in a water shortage. Changes in precipitation can substantially disrupt crops and livestock, influence the frequency and intensity of severe weather events, and affect the quality and quantity of water available for municipal and industrial use.
Learn MoreSnow drought is a period of abnormally low snowpack for the time of year. Snowpack typically acts as a natural reservoir, providing water throughout the drier summer months. Lack of snowpack storage, or a shift in timing of snowmelt, can be a challenge for drought planning.
Learn MorePeriods of drought can lead to inadequate water supply, threatening the health, safety, and welfare of communities. Streamflow, groundwater, reservoir, and snowpack data are key to monitoring and forecasting water supply.
Learn MoreDrought can reduce the water availability and water quality necessary for productive farms, ranches, and grazing lands, resulting in significant negative direct and indirect economic impacts to the agricultural sector. Monitoring agricultural drought typically focuses on examining levels of precipitation, evaporative demand, soil moisture, and surface/groundwater quantity and quality.
Learn MoreAir temperature can have wide-ranging effects on natural processes. Warmer air temperatures increase evapotranspiration—which is the combination of evaporation from the soil and bodies of water and transpiration from plants—and lower soil moisture.
Learn MoreFlash drought is the rapid onset or intensification of drought. Unlike slow-evolving drought, which is caused by a decline in precipitation, flash drought occurs when low precipitation is accompanied by abnormally high temperatures, high winds, and/or changes in radiation. These sometimes-rapid changes can quickly raise evapotranspiration rates and remove available water from the landscape.
Learn MoreAir temperature can have wide-ranging effects on natural processes. Warmer air temperatures increase evapotranspiration—which is the combination of evaporation from the soil and bodies of water and transpiration from plants—and lower soil moisture.
Learn MoreSnow drought is a period of abnormally low snowpack for the time of year. Snowpack typically acts as a natural reservoir, providing water throughout the drier summer months. Lack of snowpack storage, or a shift in timing of snowmelt, can be a challenge for drought planning.
Learn MoreDrought can reduce the water availability and water quality necessary for productive farms, ranches, and grazing lands, resulting in significant negative direct and indirect economic impacts to the agricultural sector. Monitoring agricultural drought typically focuses on examining levels of precipitation, evaporative demand, soil moisture, and surface/groundwater quantity and quality.
Learn MoreHow To
How to use this site:
- Select a timeframe to view a temperature or precipitation outlook: 6–10 days, 8–14 days, 3–4 weeks, 1 month, or 3 months.
- Move the cursor over product parameter name to display the graphic (click to enlarge).
- Click on a product parameter to view the most current map enlarged on a new page.
- Or, click "interactive" next to the product parameter to view an interactive map.
- To learn more about these outlook products, visit the Outlooks Maps, Graphs, and Tables page.
- Download KMZ/KML files and shapefiles on the GIS Data page.
Access
Climate Predication Center Home Page: View temperature, precipitation, hazards, and drought outlooks for the United States
- 6-10 day temperature and precipitation outlooks
- 8-14 day temperature and precipitation outlooks
- 3-4 week temperature and precipitation outlooks
- 1-month temperature and precipitation outlooks
- 3-month temperature and precipitation outlooks
GIS Data – Download the outlooks as shapefiles and raster data.
6–10 and 8–14 Day Outlook Archive – View past 6–10 and 8–14 day outlooks from December 2001 to the present.
Monthly and Seasonal Outlook Archive –View past monthly and seasonal outlooks from October 1995 to the present.
Outlook Verification – View forecast verification for CPC's outlook products. Verification indicates the skill of outlooks, which is a relative measure of how the outlooks performed. Knowledge of the skill of the outlooks can help users for decision making purposes.