Early Winter Check-In: Drought Remains with Areas of Improvement
Register for the January 24 CA-NV Drought and Climate Outlook Webinar.
Key Points
- California and Nevada are entering the climatological wettest three months of the year 100% in drought.
- An exceptional atmospheric river (AR 5) in October helped relieve some of the drought, but a dry November still has much of the region missing 0.5–1.25 years of precipitation.
- Snowpack and soil moisture have improved in areas receiving recent rain and snow.
- Although a wet pattern is favored for the remainder of December and drought conditions are forecasted to improve in parts of central and northern California, more precipitation is needed and drought remains region-wide.
- Both the governors of California and Nevada made drought announcements in December bringing attention to the importance of drought preparedness.
The U.S. Drought Monitor (USDM) is updated each Thursday to show the location and intensity of drought across the country. Drought categories show experts’ assessments of conditions related to dryness and drought including observations of how much water is available in streams, lakes, and soils compared to usual for the same time of year.
California/Nevada conditions as of December 14, 2021:
- 100% of California is experiencing Moderate (D1) to Exceptional (D4) Drought (52.01% in D3, 28.27% in D4)
- California population in drought: 37,253,956
- 100% of Nevada is experiencing Moderate (D1) to Exceptional (D4) Drought (31.44% in D3, 24.89% in D4)
- Nevada population in drought: 2,700,551
U.S. Drought Monitor Categories
The U.S. Drought Monitor (USDM) is updated each Thursday to show the location and intensity of drought across the country. Drought categories show experts’ assessments of conditions related to dryness and drought including observations of how much water is available in streams, lakes, and soils compared to usual for the same time of year.
California/Nevada conditions as of December 14, 2021:
- 100% of California is experiencing Moderate (D1) to Exceptional (D4) Drought (52.01% in D3, 28.27% in D4)
- California population in drought: 37,253,956
- 100% of Nevada is experiencing Moderate (D1) to Exceptional (D4) Drought (31.44% in D3, 24.89% in D4)
- Nevada population in drought: 2,700,551
Current Conditions
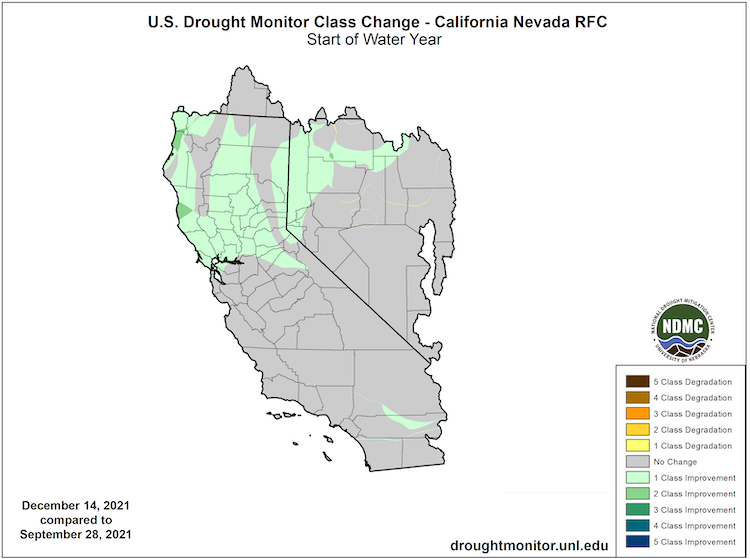
- According to the U.S. Drought Monitor, since the start of the water year (Oct. 1, 2021) drought has improved in parts of northern California and Nevada, but the region remains 100% in drought.
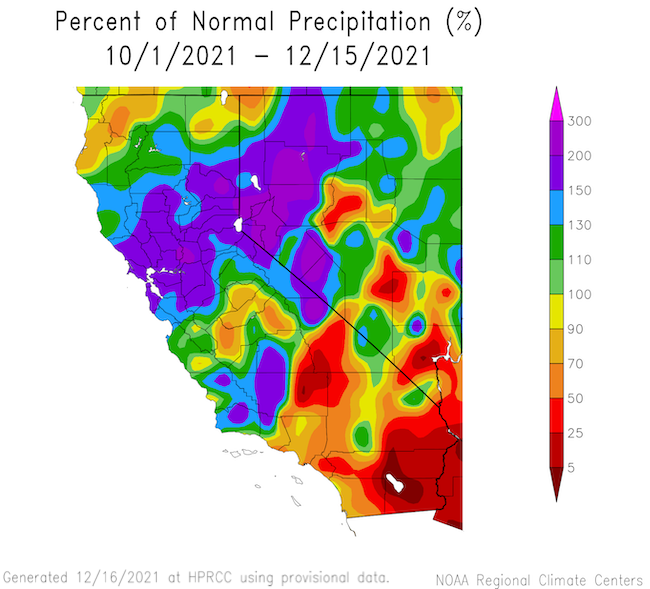
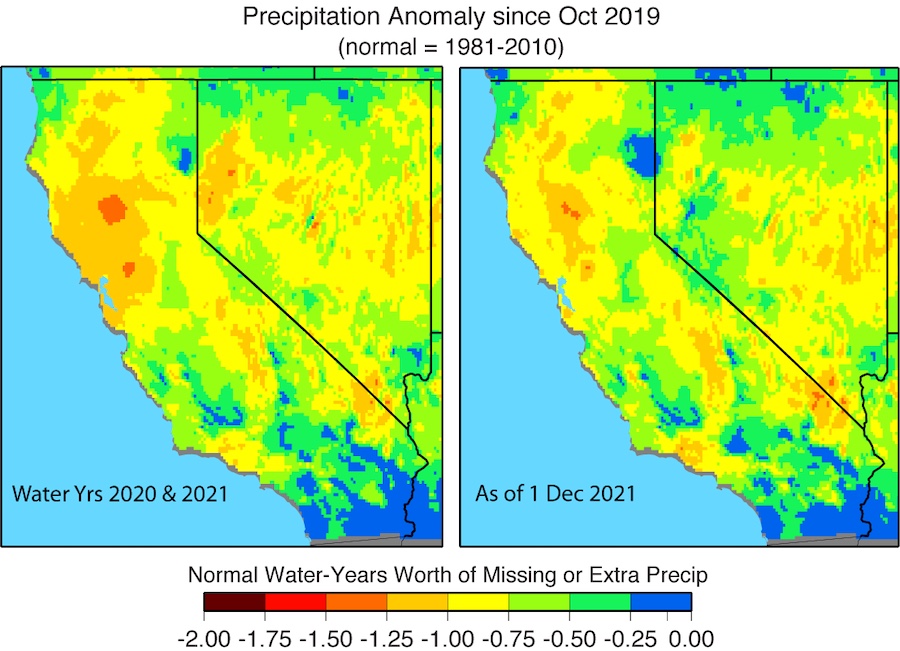
- A warm and dry November followed October’s exceptional atmospheric river (AR5) that brought widespread rain, snow, and wind to parts of the West, leaving much of the region yet missing 0.5–1.25 years of precipitation.
- Following a series of storms in mid-December, California’s overall snow water equivalent (SWE) jumped from from 18% of normal on December 1 to 83% of normal on December 15 based on California Department of Water Resources snow pillows; most of this increased snowpack has come between December 13–15 as several storms slammed into the Sierra Nevada.
- Over the last three days, December 14–16, the atmospheric river increased the 8-station index by 5% of the end of year water year normal precipitation, approximately a 9% increase in Los Angeles and San Diego, and an 8% increase for the Reno/Carson City Area.
- Beneficial precipitation has improved soil moisture conditions and reservoir levels, although many remain below their historical averages.
How Is Drought Impacting Your Neighborhood?
Click to see drought indicators, outlooks, and historical conditions by city, county, and state, and to sign up for local drought alert emails.
U.S. Drought Monitor Change Map: Water Year To Date
Percent of Normal Precipitation: Water Year to Date
Precipitation Anomalies Since October 2019
Total Precipitation: November 2021

Reno/Carson City Percent of Normal Precipitation

Total Precipitation: December 9–16

Change in SWE and Snow Depth: December 12–16


California Reservoir Conditions

Recent Drought Impacts
- Find additional impacts through the National Drought Mitigation Center’s Drought Impact Reporter.
- December 14: Governor of Nevada released a proclamation, "Climate Change Threatens Nevada with Aridification."
- December 1: "The California Department of Water Resources Announces Initial State Water Project Allocation, Additional Actions to Prepare for Third Dry Year."
- In early December, the California State Water Resources Control Board proposed new emergency drought regulations aimed at wasteful water practices. Comments are due by December 23.
- November 9: The Metropolitan Water District declared a drought emergency.
- October 19: The Governor of California expanded the drought emergency statewide.
- Water Supply: The San Francisco Public Utilities Commission declared a water emergency and encouraged customers to curb water use by 10% compared to 2019–2020. Cities across California continue to amp up drought response and conservation efforts.
- Agriculture: Almond production in California is expected to drop 10% because of high temperatures and drought. Drought has also led to lower yield and smaller citrus fruit.
- Wildlife & Ecosystems:
- November 19:" California Department of Fish and Wildlife Saves More Than 2 Million Chinook Salmon From Drought; Begins Releasing Fish Into Klamath River As Conditions Improve."
- Migrating birds have been hit hard by California’s drought (CalMatters).
- Recreation and Tourism:
- The slow start to the snow season is impacting snow recreation, including delaying the opening of ski resorts, which has far-reaching impacts on the local economies.
- Drought has impacted some bird populations, with reported impacts on hunting in Nevada.
Drought & Climate Outlook
El Niño–Southern Oscillation (ENSO)
NOAA’s ENSO alert system status is currently a La Niña Advisory. La Niña is favored to continue through the Northern Hemisphere winter 2021–22 (~95% chance) and transition to ENSO-neutral during the spring 2022 (~60% chance during April–June). For more information, please check out the NOAA ENSO blog.
Subseasonal to Seasonal Drought, Temperature, and Precipitation Outlooks
Forecasts for the next three months show drought persisting across southern California and Nevada as well as the Colorado River Basin, with the exception of drought remaining but improving in northern and central California. Historically, La Niña is associated with dry to normal conditions in the southern part of California and Nevada. The area of improvement is forecasted based on high climatological precipitation, the wet short- and medium-range outlooks, and recently improved incipient conditions. The January-February-March outlook from the National Weather Service’s Climate Prediction Center shows below-normal or equal chances of normal temperatures for the region.
The forecast models are suggesting there will be another storm next week impacting mostly California. The 7-day forecast precipitation totals range from less than half an inch to five inches, with the northern California coastal mountains and Sierra Nevada mountains forecasted to get the most precipitation.
Seasonal Drought Outlook: December 16, 2021–March 31, 2022

Temperature and Precipitation Outlooks: January–March 2022


Likelihood and Timing of Atmospheric River Conditions

Drought Early Warning Resources
Prepared By
Amanda Sheffield
California-Nevada DEWS Regional Drought Information Coordinator, NOAA/NIDIS, CIRES
Email: amanda.sheffield@noaa.gov
Julie Kalansky
Program Manager, California-Nevada Climate Applications Program (a NOAA RISA team)
Email: jkalansky@ucsd.edu
This drought status update is issued in partnership between the National Oceanic and Atmospheric Administration (NOAA), the California-Nevada Applications Program, a NOAA RISA team, and the Western Regional Climate Center at the Desert Research Institute to communicate the current state of drought conditions in California-Nevada based on recent conditions and the upcoming forecast. NIDIS and its partners will issue future drought updates as conditions evolve.