A Wet December: Drought buster, false hope, or somewhere in between?
Register for the January 24 CA-NV Drought and Climate Outlook Webinar.
Key Points
- December storms brought more than 200% of normal precipitation to a large area of California and Nevada. In the Sierra Nevada, much of this fell as snow.
- Recent storms improved the drought status by 1–2 categories, according to the U.S. Drought Monitor, throughout much of the region. Combined snow plus reservoir levels are near normal or above in the Southern Sierra for this time of year, but still below normal in the Northern Sierra.
- Extended range forecasts for January indicate the next two weeks will have below-normal precipitation. January and February precipitation is critical in determining if the December storms are the beginning to the end of the drought (i.e., stormy pattern returns by late January) or will help mitigate the impacts of the ongoing drought, but not end it (i.e., extended dry pattern continues in February).
The U.S. Drought Monitor (USDM) is updated each Thursday to show the location and intensity of drought across the country. Drought categories show experts’ assessments of conditions related to dryness and drought including observations of how much water is available in streams, lakes, and soils compared to usual for the same time of year.
California/Nevada conditions as of January 4, 2022:
- 99.3% of California is experiencing Moderate (D1) to Exceptional (D4) Drought (15.76% in D3, 0.84% in D4)
- California population in drought: 37,223,546
- 100% of Nevada is experiencing Moderate (D1) to Exceptional (D4) Drought (16.71% in D3, 7.5% in D4)
- Nevada population in drought: 2,700,551
U.S. Drought Monitor Categories
The U.S. Drought Monitor (USDM) is updated each Thursday to show the location and intensity of drought across the country. Drought categories show experts’ assessments of conditions related to dryness and drought including observations of how much water is available in streams, lakes, and soils compared to usual for the same time of year.
California/Nevada conditions as of January 4, 2022:
- 99.3% of California is experiencing Moderate (D1) to Exceptional (D4) Drought (15.76% in D3, 0.84% in D4)
- California population in drought: 37,223,546
- 100% of Nevada is experiencing Moderate (D1) to Exceptional (D4) Drought (16.71% in D3, 7.5% in D4)
- Nevada population in drought: 2,700,551
Current Conditions
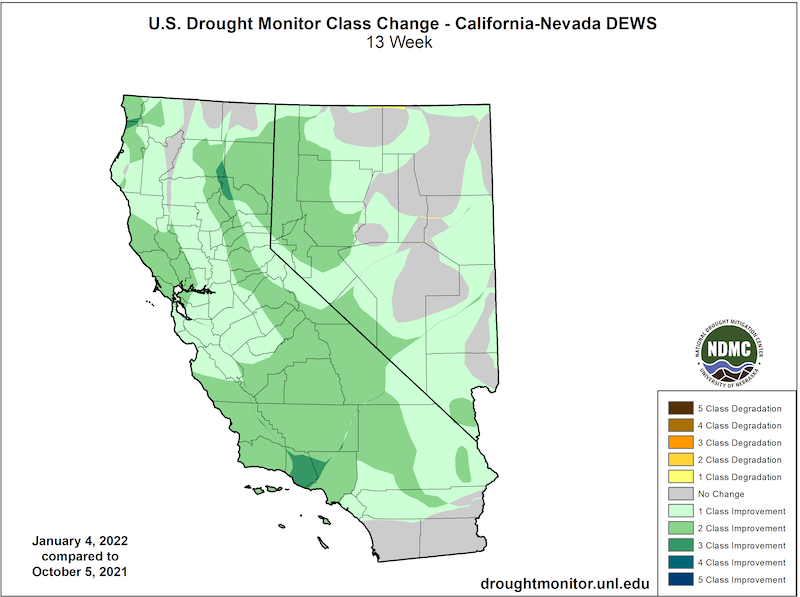
- According to the U.S. Drought Monitor, since the start of the water year (Oct. 1, 2021) drought in California-Nevada has improved 1–2 categories across much of the region with a 3-category improvement over Ventura County, California. California is no longer 100% in drought.
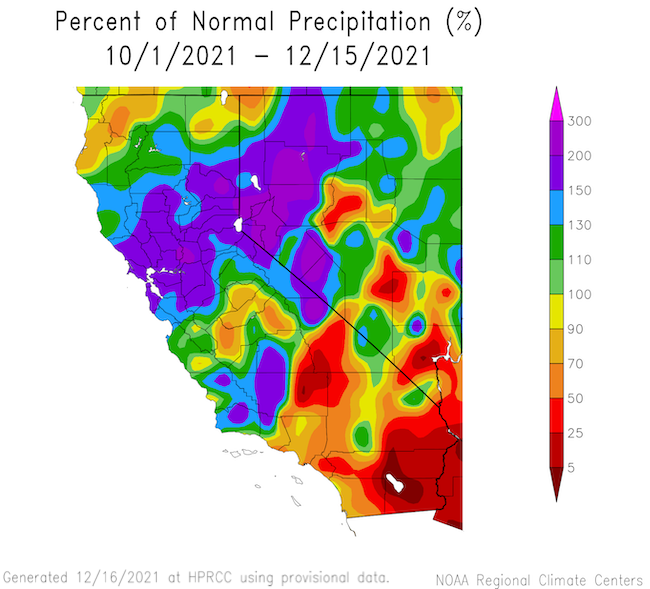
- Most of the region has received over 100% of normal precipitation for this time of year. The exceptions are in southeastern California and southern Nevada.
- Late December storms increased snowpack significantly. California went from 25% of April 1 normal snow water equivalent (SWE) on December 20 to 57% on January 5. Similarly, the Upper Humboldt SWE increased by 4.1 inches.
- Water storage, represented here as reservoir plus snowpack, in the Southern Sierra is above normal for this time of year and near normal for the Central Sierra and Lake Tahoe. Northern Sierra water storage remains below normal.
- The odds of reaching water year normal precipitation, as of January 1, have increased to 70% or above for much of the region, with the exception of much lower odds in southern Nevada and southeast California. The large deficit from last year makes the odds of combined 2021–2022 Water Years reaching a two-year normal (bottom right) less than 10% for almost the entire region.
How Is Drought Impacting Your Neighborhood?
Click to see drought indicators, outlooks, and historical conditions by city, county, and state, and to sign up for local drought alert emails.
U.S. Drought Monitor Change Map: October 5–January 4
Percent of Normal Precipitation: Water Year to Date
Percent of Normal Precipitation: Last 14 Days

Snow Water Equivalent in the Sierra Nevada Region: December 20 vs. January 5


Upper Humboldt Snow Water Equivalent

Reservoir Storage + Snowpack: WY 2021–2022


Odds of Reaching Water Year Normal Precipitation

Recent Drought Impacts
- Find additional impacts through the National Drought Mitigation Center’s Drought Impact Reporter.
- January 4: The California State Water Resources Control Board imposed new drought rules for water use within 48 hours of rainfall. The rules will be in place for one year.
- January 4: Lake Oroville’s Hyatt Powerplant began operating again as reservoir levels rose. The powerplant was shut down on August 5.
- The California Department of Fish and Wildlife estimated only 2.6% of the winter-run Chinook salmon juvenile populations survived the hot, dry summer.
- December 23: The California Department of Water Resources awarded more than $53 million in urban and multi-benefit drought relief funding.
- December 20: The U.S. Bureau of Reclamation funding plan includes $61.8 million to the Central Valley Project to address ongoing drought needs.
- December 15: Water leaders in Arizona, Nevada, and California signed an agreement at the Colorado River Water Users Association to voluntarily reduce their take from the Colorado River.
Drought & Climate Outlook
El Niño–Southern Oscillation (ENSO)
NOAA’s ENSO alert system status is currently a La Niña Advisory. La Niña is favored to continue through the Northern Hemisphere winter 2021–22 (~95% chance) and transition to ENSO-neutral during the spring 2022 (~60% chance during April–June). For more information, please check out the NOAA ENSO blog.
Subseasonal to Seasonal Drought, Temperature, and Precipitation Outlooks
The next three months’ forecasts show drought persisting across Nevada and remaining but improving over much of California, with removal likely in the south coast. Changes were introduced for California and Nevada in the seasonal drought outlook at the end of December due to a wet pattern during late December across the western contiguous U.S., favoring improvement. Modifications included depicting improvement (D2–D4 areas) and removal (D1 areas) across parts of the Great Basin, Southwest, and California.
According to the National Weather Service's Climate Prediction Center (CPC), during the first three months of 2022 (January-February-March), the pattern across North America is likely to be strongly influenced by ongoing La Niña conditions, which typically favor an active weather pattern and below-normal temperatures across the Pacific Northwest, northern California, northwest Nevada, and north-central CONUS, as well as abnormally dry, warm conditions across the southern tier of states. The CPC January and January-February-March temperature and precipitation outlooks broadly reflect this signal, with a potential for below-normal precipitation in southern California and southern Nevada with equals chances of above- or below-normal precipitation for the rest of the region (except for small area along the northern California and Nevada borders that slightly favors above-normal precipitation). Therefore, due to the current conditions combined with seasonal outlooks, drought improvement is favored for much of coastal central and northern California and the Sierra Nevada, while persistence is maintained across the San Joaquin Valley, which relies more on spring snowmelt for moisture. In the near term, a weaker system is expected later this week to impact northern California and Nevada, followed by a lull in storminess as a high pressure system is established in the eastern Pacific.
Seasonal Drought Outlook: January 1–March 31, 2022

Temperature and Precipitation Outlooks: January 2022

Likelihood and Timing of Atmospheric River Conditions

Drought Early Warning Resources
Prepared By
Amanda Sheffield
California-Nevada DEWS Regional Drought Information Coordinator, NOAA/NIDIS, CIRES
Email: amanda.sheffield@noaa.gov
Julie Kalansky
Program Manager, California-Nevada Climate Applications Program (a NOAA RISA team)
Email: jkalansky@ucsd.edu
This drought status update is issued in partnership between the National Oceanic and Atmospheric Administration (NOAA), the California-Nevada Applications Program, a NOAA RISA team, and the Western Regional Climate Center at the Desert Research Institute to communicate the current state of drought conditions in California-Nevada based on recent conditions and the upcoming forecast. NIDIS and its partners will issue future drought updates as conditions evolve.