Drought Expanded and Intensified in Southern and Central California and Nevada, and Is Expected to Worsen
Our thoughts are with all of those, including many of our partners, who have been impacted by the devastating wildfires in Los Angeles. As critical fire weather conditions continue for Southern California, get the latest fire weather forecasts, maps, and safety information from the National Weather Service.
Key Points
- Extreme record or near-record dryness since the start of the water year (October 1, 2024) has expanded and intensified drought in southern and central California and Nevada, including in the area of the Los Angeles wildfires.
- Strong Santa Ana wind events continue to impact Southern California, where vegetation is already quite dry. This further increased the short-term dryness due to high evaporative demand in Southern California.
- Outlooks for the next two weeks suggest the dry conditions and critical fire weather conditions will continue across the region.
- With 1–2 months remaining in the climatologically wettest part of the year, there is time for wet conditions to return. However, due to the persistent dry conditions since the start of the water year, wet conditions may, at best, slightly reduce drought conditions.
- Drought preparedness is key due to the potential worsening of drought conditions and impacts, especially those who may be impacted in the short term.
Register for the January 27 California-Nevada Drought and Climate Outlook Webinar, which will provide an overview of climate and drought conditions, impacts, and outlooks.
U.S. Drought Monitor conditions from the start of the water year (October 1, 2024) to present (January 14, 2025).
The U.S. Drought Monitor depicts the location and intensity of drought across the country. The map uses 5 classifications: Abnormally Dry (D0), showing areas that may be going into or are coming out of drought, and four levels of drought (D1–D4).
The U.S. Drought Monitor is a joint effort of the National Oceanic and Atmospheric Administration, U.S. Department of Agriculture, and National Drought Mitigation Center.
This U.S. Drought Monitor Water Year 2025 change map shows where drought has improved, degraded, or remained the same from October 1, 2024 to January 14, 2025.
Yellow shades indicate drought degradation, while green shades indicate drought improvement, according to the U.S. Drought Monitor.
U.S. Drought Monitor Categories
Abnormally Dry (D0)
Abnormally Dry (D0) indicates a region that is going into or coming out of drought. View typical impacts by state.
Moderate Drought (D1)
Moderate Drought (D1) is the first of four drought categories (D1–D4), according to the U.S. Drought Monitor. View typical impacts by state.
Severe Drought (D2)
Severe Drought (D2) is the second of four drought categories (D1–D4), according to the U.S. Drought Monitor. View typical impacts by state.
Extreme Drought (D3)
Extreme Drought (D3) is the third of four drought categories (D1–D4), according to the U.S. Drought Monitor. View typical impacts by state.
Exceptional Drought (D4)
Exceptional Drought (D4) is the most intense drought category, according to the U.S. Drought Monitor. View typical impacts by state.
Drought Degradation
5-Category Degradation
Drought/dryness has worsened by 5 categories, according to the U.S. Drought Monitor.
4-Category Degradation
Drought/dryness has worsened by 4 categories, according to the U.S. Drought Monitor.
3-Category Degradation
Drought/dryness has worsened by 3 categories, according to the U.S. Drought Monitor.
2-Category Degradation
Drought/dryness has worsened by 2 categories, according to the U.S. Drought Monitor.
1-Category Degradation
Drought/dryness has worsened by 1 category, according to the U.S. Drought Monitor.
Drought Improvement
1-Category Improvement
Drought/dryness has improved by 1 category, according to the U.S. Drought Monitor.
2-Category Improvement
Drought/dryness has improved by 2 categories, according to the U.S. Drought Monitor.
3-Category Improvement
Drought/dryness has improved by 3 categories, according to the U.S. Drought Monitor.
4-Category Improvement
Drought/dryness has improved by 4 categories, according to the U.S. Drought Monitor.
5-Category Improvement
Drought/dryness has improved by 5 categories, according to the U.S. Drought Monitor.
U.S. Drought Monitor conditions from the start of the water year (October 1, 2024) to present (January 14, 2025).
The U.S. Drought Monitor depicts the location and intensity of drought across the country. The map uses 5 classifications: Abnormally Dry (D0), showing areas that may be going into or are coming out of drought, and four levels of drought (D1–D4).
The U.S. Drought Monitor is a joint effort of the National Oceanic and Atmospheric Administration, U.S. Department of Agriculture, and National Drought Mitigation Center.
This U.S. Drought Monitor Water Year 2025 change map shows where drought has improved, degraded, or remained the same from October 1, 2024 to January 14, 2025.
Yellow shades indicate drought degradation, while green shades indicate drought improvement, according to the U.S. Drought Monitor.
This U.S. Drought Monitor is released every Thursday morning, with data valid through Tuesday at 7 a.m. ET.
This U.S. Drought Monitor (USDM) and USDM change maps are released every Thursday morning, with data valid through Tuesday at 7 a.m. ET.
This update is based on data available as of Thursday, January 16, 2025 at 9:00 a.m. PT. We acknowledge that conditions are evolving.
Current Drought Conditions for California/Nevada
- Midway through the climatological wet season, there is a strong precipitation difference (Figure 1) between northern and southern California-Nevada. The southern part of California, especially along the coast, is experiencing the driest start to the water year in 44 years (Figure 2).
- Combining this dryness, which began 9 months ago and has intensified, with a warmer-than-normal summer and fall led to Extreme Drought (D3) in southern Nevada, while Severe Drought (D2) expanded across Southern California, according to the U.S. Drought Monitor. This is a 1–3 drought class degradation since the start of the water year.
- The Los Angeles wildfires are ongoing, and a preliminary analysis by UCLA illustrates the role of unusual drying conditions following back to back wet years in these wildfires. Learn more about the intersection of drought and wildfire.
- If conditions continue to be dry through the remainder of January, the area of record water year dryness will expand further across the southern portion of the region (Figure 3).
- In the southern coast of California (Climate Division 6), only ten water years (October–September) going back to 1895 have received less than 1 inch of precipitation by the end of December. Nine of those ten water years ended below average, but four of the ten were able to end closer to average (i.e., >80% of average) with one of the water years finishing just above average.
- Anomalous evaporative demand, a measure of the “thirst” of the atmosphere, since June has further exacerbated the drought conditions by drying out the landscape (Figure 4). This is in part due to high temperatures this past summer, extending into fall.
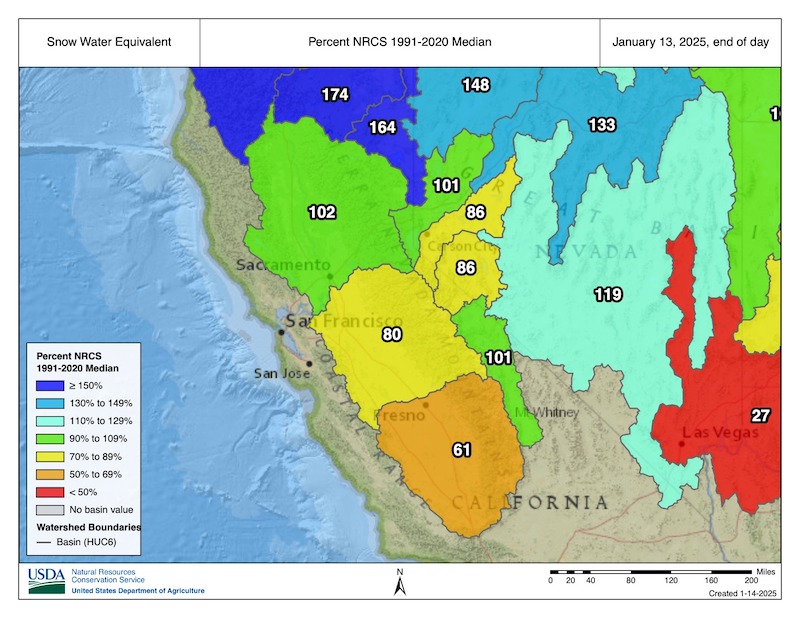
- Current snow water equivalent (Figure 5) status exhibits a similar contrast between the north and south. This month’s western snow drought status update reported that far southern Sierra Nevada (from Lone Pine southward) and the Spring Mountains in southern Nevada received very little precipitation over the past month with well-below-normal snow water equivalent.
Figure 1: Water Year to Date Precipitation Is Below Normal in Central and Southern California-Nevada
Key Takeaway: There is a strong precipitation difference between north and south, with the northern part of the region receiving above-normal precipitation, the central part of the region receiving between 50%–70% of normal, and the southern part of the region receiving only 20%–50% of normal precipitation.
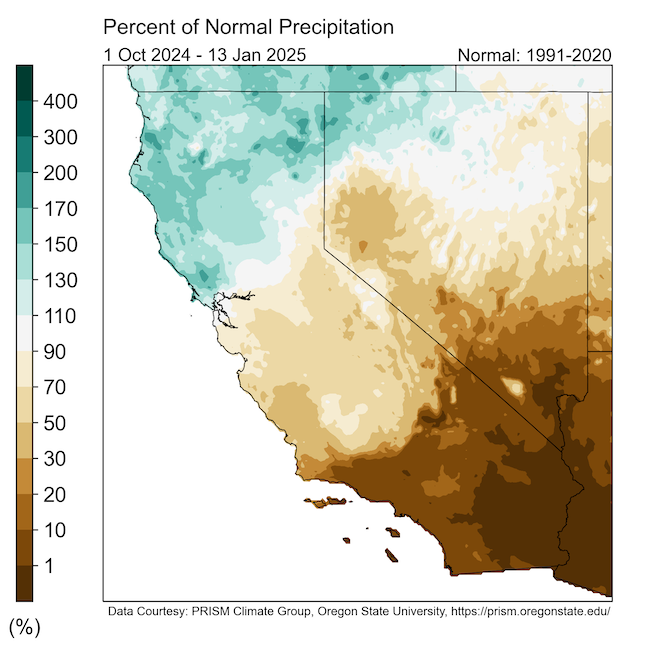
Figure 2: Driest Start to the Water Year in a 44-Year Record
Key Takeaway: This has been the driest start to the water year in a 44-year record for much of coastal southern California, and in the top 5 driest for much of the southern third of the region.
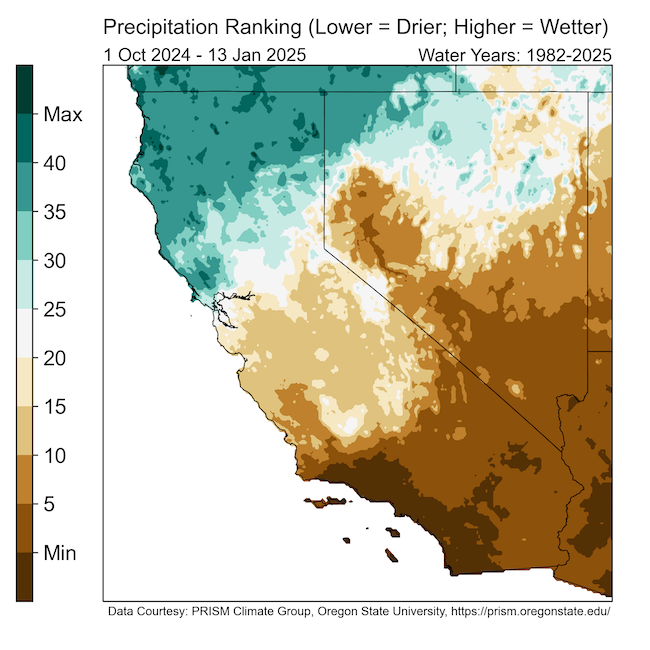
Figure 3: What If There Is No Additional Precipitation in January? Driest Start to the Water Year Will Expand If No More Precipitation Is Received
Key Takeaway: Regions with record dry starts to the water year will expand if the extended range forecast comes to fruition and southern California and Nevada receive no additional precipitation in January.
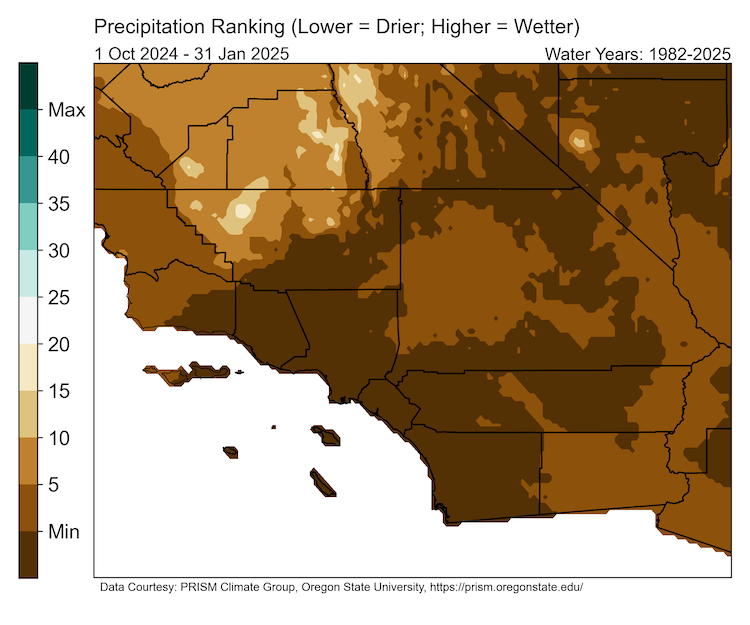
Figure 4: High Evaporative Demand Across Much of the Region for June 2024–January 2025
Key Takeaway: High evaporative demand throughout the summer, fall, and now into winter has dried out the landscape, further exacerbating drought conditions in southern and central California and Nevada.
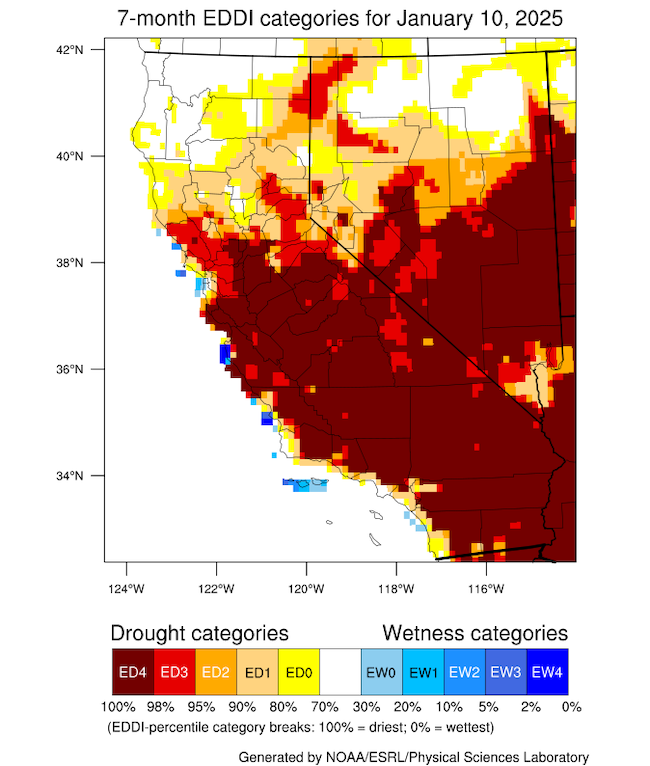
Figure 5: Snow Water Equivalent Shows North–South Difference in California and Nevada
Key Takeaway: Snow water equivalent observations show a similar north–south difference with the northern and central Sierra receiving above 80% of median and the southern Sierra at 61% of median.
California-Nevada Drought Impacts
- Recent dry conditions combined with recent and ongoing weather and fuel conditions played a devastating role in the catastrophic wildfire events in the Los Angeles area.
- Fuel dryness in Southern California in early January was at a level one would expect in September and October, before typical winter precipitation starts. Fire danger was extreme, exceeding the 98th percentile.
- The currently active fires burned 38,690 acres as of January 15. On January 8, California received a Major Disaster Declaration for the California wildfires. As of January 12, California has mobilized more than 15,000+ personnel, including firefighters, guard servicemembers, highway patrol officers, and transportation teams to support the ongoing firefight. The state of California also has set up a resources web page for those impacted.
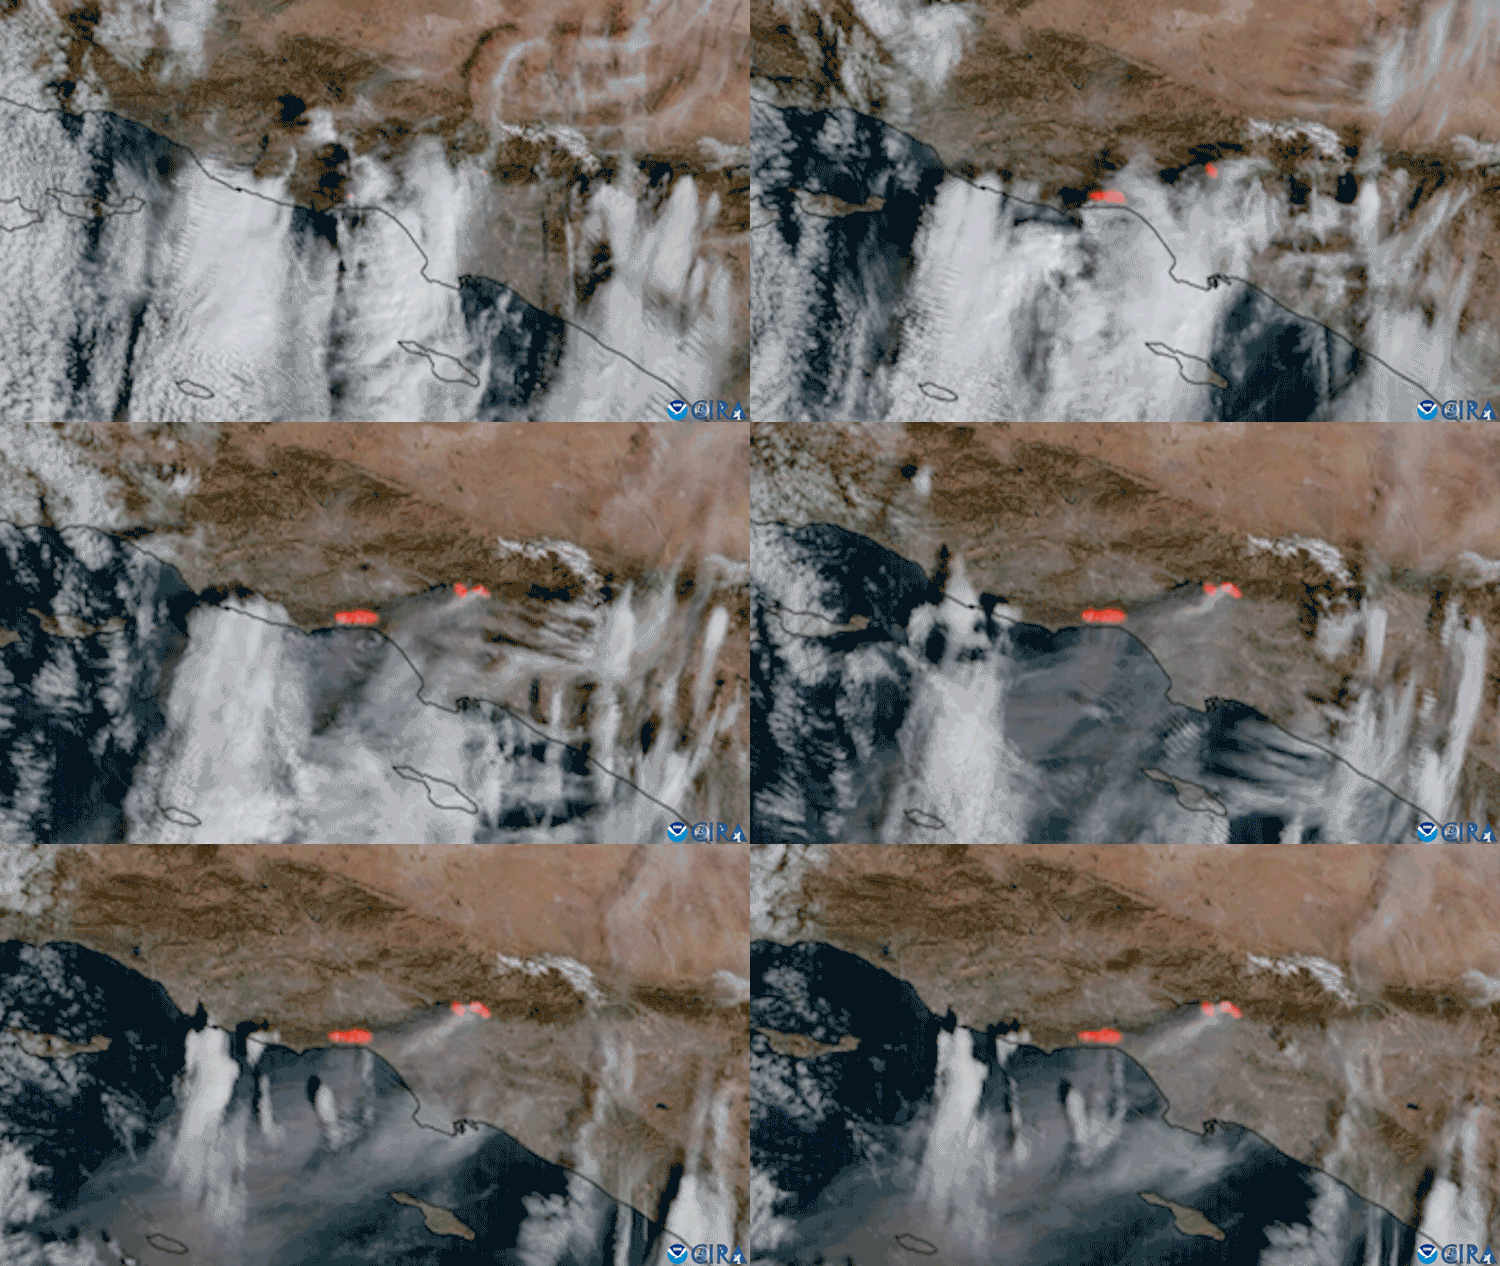
Figure 6: Satellite Imagery Shows Rapid Fire Development in Southern California
Key Takeaway: Satellite imagery of the rapid development, including fire temperature, of the Palisade and Eaton fires.
- Short- and long-term droughts differ in the timescales over which they occur, their impacts, and their monitoring. During this period of drought development, short-term drought impacts (e.g., impacts to rain-fed agriculture, wildfire risk, surface water reductions) will likely begin and intensify in correlation with worsening drought conditions.
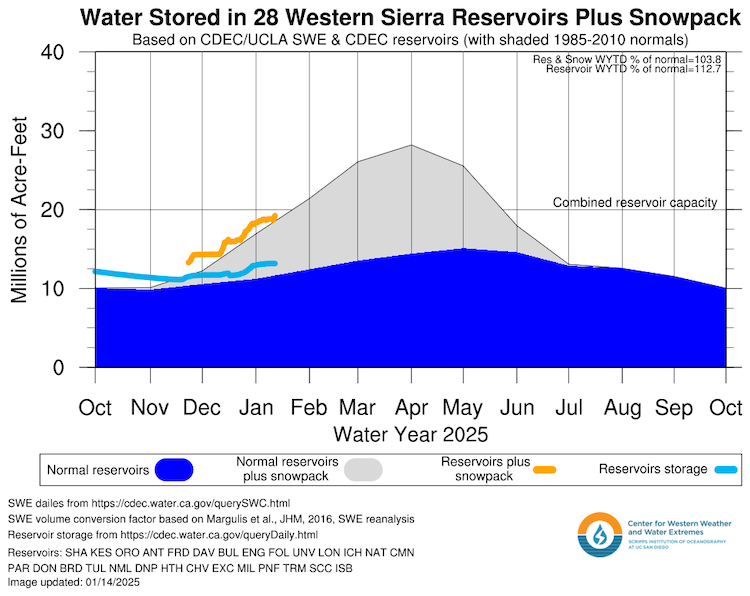
- Drought has not yet significantly impacted water supplies in California and Nevada. Major California water supply reservoirs are near or above their historical averages, and the reservoir plus snowpack total is near normal (Figure 7). However, in Nevada, reservoir storage is at a lower capacity compared to last year (See NRCS, page 8).
- Upper Colorado River Basin precipitation and snowpack conditions are near normal. Lake Powell and Lake Mead levels are above what they were at this time last year, with Powell 37% full and Mead 34% full.
Report your local drought impacts through a Condition Monitoring Observer Report:
Figure 7: Normal Amount of Water Stored in Western Sierra Reservoirs Plus Snowpack
Key Takeaway: As of January 14, water storage in Western Sierra reservoirs plus snowpack was close to normal for this time of year.
Outlooks and Forecasts for California-Nevada
- NOAA’s El Niño–Southern Oscillation (ENSO) alert system status is currently a La Niña Advisory. La Niña conditions—which historically have meant normal to dry winters in Southern California and Nevada—are present. La Niña is expected to persist through February–April 2025 (59% chance), with a transition to ENSO-neutral likely during March–May 2025 (60% chance). For more information, check out the NOAA Climate.gov ENSO blog.
- Fire potential is above normal for the southern coast of California in January. Elevated risk is due to persistently dry and developing drought conditions combined with weather events (e.g., offshore wind events) and fuel conditions, which are susceptible to rapid drying.
- Monthly (issued on the first of the month) and daily (updated by 12 p.m. MT) outlooks are available from NIFC Predictive Services.
- As critical fire weather conditions continue for Southern California, get the latest fire weather forecasts, maps, and safety information.
- Short-term forecasts (through January 29; Figure 8) from the NOAA National Weather Service Climate Prediction Center (CPC) favor the continuing dry pattern across California and Nevada, with above-normal to near-normal temperatures. CPC also forecasts the risk of reoccurring Santa Ana wind events and associated critical fire weather conditions, which may diminish with weather pattern shifts later in the month.
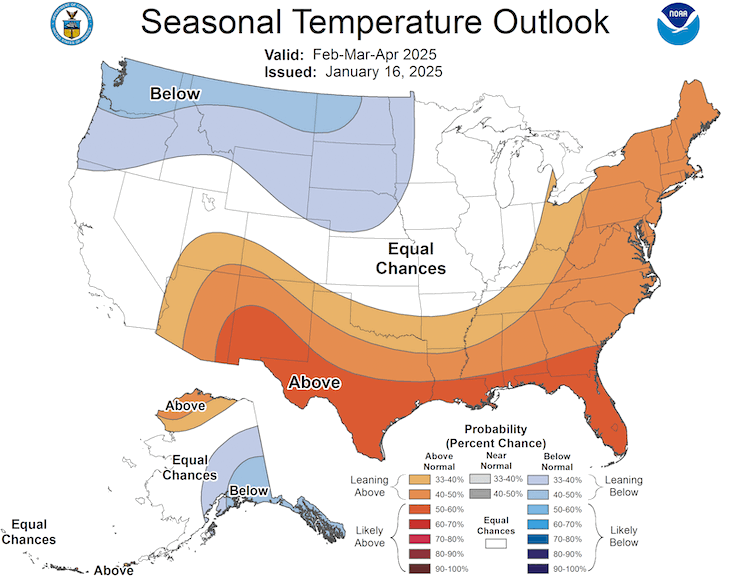
- CPC’s seasonal outlooks (February–April) continue to favor a similar pattern to previous months, slightly favoring wetter conditions in the northern part of the region and drier in the southern part of the region (Figures 9, 10). However, a large portion of the region has equal chances of above-, below-, or near-normal precipitation. The recent (January 13) Center for Western Weather and Water Extremes (CW3E) Seasonal Outlook favors below-normal precipitation in Southern California and uncertainty over Northern and Central California. Temperature outlooks are uncertain and suggest equal chances of below-normal, normal, and above-normal temperatures.
- Existing drought conditions are forecast to persist over the next three months.
Figure 8: Below- and Near-Normal Precipitation Is Likely Over the Next 8–14 Days
Key Takeaway: Odds favor below-normal to near-normal precipitation in the Climate Prediction Center’s 8–14 day outlook (valid January 23-29).
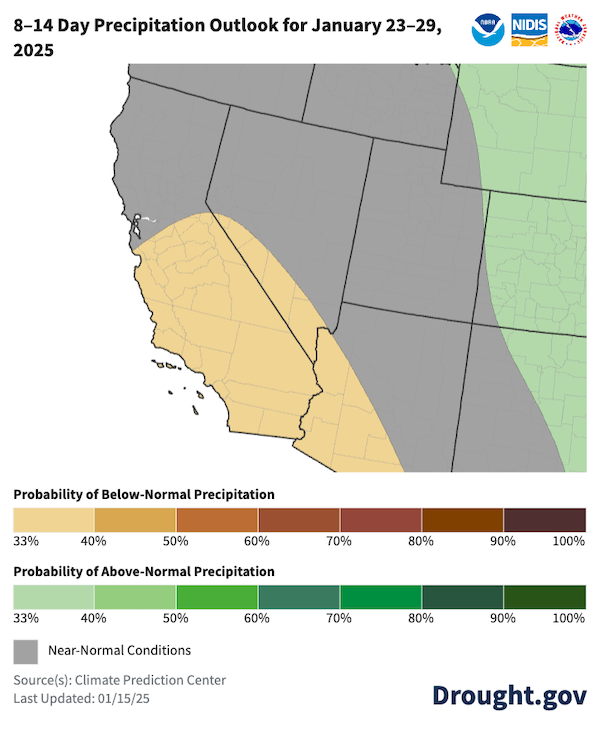
Figure 9: Seasonal (3-Month) Precipitation Outlook Leans Normal to Dry
Key Takeaway: The NOAA Climate Prediction Center’s seasonal outlooks favor a continued north-south difference in above-normal to below-normal conditions through February-March-April. However, a large portion of the region has equal chances of above-, below-, or near-normal precipitation.
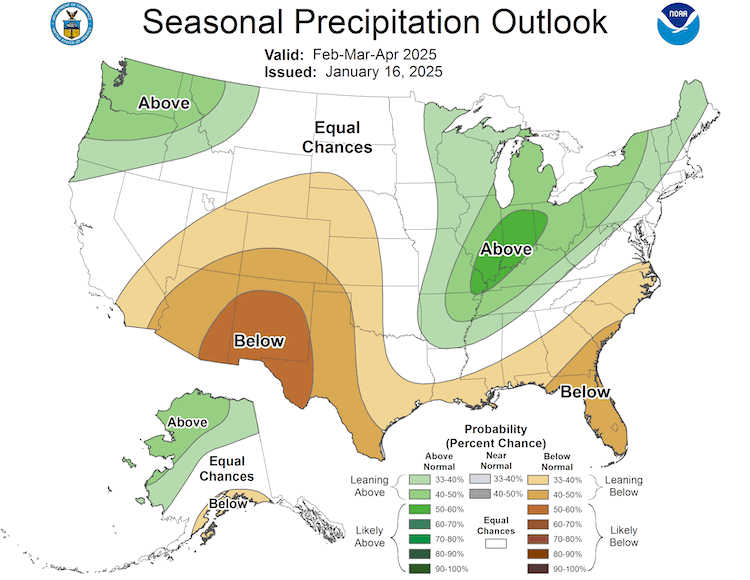
Figure 10: Uncertainty In Temperature Outlook Over the Next Three Months
Key Takeaway: Seasonal outlooks favor equal chances of below-normal, normal, and above-normal temperatures for the region.
Resources
- Explore regional and state drought information:
- NIDIS and partners are piloting a series of Southern California Sector-Specific Drought Early Warning Outlooks in Water Year 2025. Learn more and get involved by contacting Amanda Sheffield (amanda.sheffield@noaa.gov).
Register for the January 27 California-Nevada Drought and Climate Outlook Webinar, which will provide an overview of climate and drought conditions, impacts, and outlooks.
Read the latest Western Regional Snow Drought Status Update.
Prepared By
Amanda Sheffield
NOAA/NIDIS California-Nevada DEWS Regional Drought Information Coordinator, Cooperative Institute for Research in Environmental Sciences (CIRES)
Julie Kalansky
Principal Investigator California-Nevada Adaptation Program (a NOAA CAP team)
This Drought Status Update is issued in partnership between the National Oceanic and Atmospheric Administration (NOAA) and the California-Nevada Adaptation Program (a NOAA CAP team) and the Western Regional Climate Center at the Desert Research Institute to communicate a potential area of concern for drought expansion and/or development within the California-Nevada DEWS region based on recent conditions and the upcoming forecast. Thank you to our partners at California Department of Water Resources, NOAA’s National Weather Service, and Center for Western Weather and Water Extremes (CW3E) for their review. NIDIS and its partners will issue future Drought Status Updates as conditions evolve.


