Drought Returned to the Southeast in a Flash, but Some Relief Is in Sight
Key Points
- Excessive heat, extreme dryness and sporadic rain over the past month led to a rapid intensification and expansion of drought conditions across much of the Southeast region.
- Crops, such as corn and soybeans, have been hard hit, and streamflows are at or near historic levels in some areas.
- Heavy rains from this past weekend improved drought conditions in the eastern Carolinas and southeast Virginia.
- Looking ahead, additional drought relief is expected over the next two weeks for much of the northern part of the region, while areas expected to miss the heavy rainfall such as western Tennessee may be at risk for further drought development.
U.S. Drought Monitor map for the Southeast, showing the change in drought conditions from June 11–July 9, 2024. The U.S. Drought Monitor is updated each Thursday to show the location and intensity of drought & dryness across the country using five categories, from Abnormal Dryness (D0) to Exceptional Drought (D4).
Key takeaway: There was a drastic change in drought conditions across the region in the past month. Drought coverage essentially flipped, from severe drought isolated to central and south Florida in June to drought covering much of the northern parts of the Southeast in July.
A drought index combines multiple drought indicators (e.g., precipitation, temperature, soil moisture) to depict drought conditions. For some products, like the U.S. Drought Monitor, authors combine their analysis of drought indicators with input from local observers. Other drought indices, like the Standardized Precipitation Index (SPI), use an objective calculation to describe the severity, location, timing, and/or duration of drought.
Learn MorePeriods of drought can lead to inadequate water supply, threatening the health, safety, and welfare of communities. Streamflow, groundwater, reservoir, and snowpack data are key to monitoring and forecasting water supply.
Learn MoreDrought can reduce the water availability and water quality necessary for productive farms, ranches, and grazing lands, resulting in significant negative direct and indirect economic impacts to the agricultural sector. Monitoring agricultural drought typically focuses on examining levels of precipitation, evaporative demand, soil moisture, and surface/groundwater quantity and quality.
Learn MoreU.S. Drought Monitor
D0 - Abnormally Dry
Abnormally Dry (D0) indicates a region that is going into or coming out of drought, according to the U.S. Drought Monitor. View typical impacts by state.
D1 – Moderate Drought
Moderate Drought (D1) is the first of four drought categories (D1–D4), according to the U.S. Drought Monitor. View typical impacts by state.
D2 – Severe Drought
Severe Drought (D2) is the second of four drought categories (D1–D4), according to the U.S. Drought Monitor. View typical impacts by state.
D3 – Extreme Drought
Extreme Drought (D3) is the third of four drought categories (D1–D4), according to the U.S. Drought Monitor. View typical impacts by state.
D4 – Exceptional Drought
Exceptional Drought (D4) is the most intense drought category, according to the U.S. Drought Monitor. View typical impacts by state.
U.S. Drought Monitor map for the Southeast, showing the change in drought conditions from June 11–July 9, 2024. The U.S. Drought Monitor is updated each Thursday to show the location and intensity of drought & dryness across the country using five categories, from Abnormal Dryness (D0) to Exceptional Drought (D4).
Key takeaway: There was a drastic change in drought conditions across the region in the past month. Drought coverage essentially flipped, from severe drought isolated to central and south Florida in June to drought covering much of the northern parts of the Southeast in July.
The U.S. Drought Monitor is updated weekly on Thursday mornings, with data valid through the previous Tuesday at 7 a.m. ET.
A drought index combines multiple drought indicators (e.g., precipitation, temperature, soil moisture) to depict drought conditions. For some products, like the U.S. Drought Monitor, authors combine their analysis of drought indicators with input from local observers. Other drought indices, like the Standardized Precipitation Index (SPI), use an objective calculation to describe the severity, location, timing, and/or duration of drought.
Learn MorePeriods of drought can lead to inadequate water supply, threatening the health, safety, and welfare of communities. Streamflow, groundwater, reservoir, and snowpack data are key to monitoring and forecasting water supply.
Learn MoreDrought can reduce the water availability and water quality necessary for productive farms, ranches, and grazing lands, resulting in significant negative direct and indirect economic impacts to the agricultural sector. Monitoring agricultural drought typically focuses on examining levels of precipitation, evaporative demand, soil moisture, and surface/groundwater quantity and quality.
Learn MoreCurrent Conditions: Drought Continues to Develop and Expand
- Despite a wet winter and spring, the scattered nature of rainfall, below normal precipitation, and soaring temperatures collectively led to the rapid intensification of drought across the region. In June, most of the Southeast was drier than normal, except southern Florida. Some locations experienced a record or near-record driest June.
- According to the U.S. Drought Monitor, 81% of the region is experiencing Drought (D1-D4) or Abnormally Dry (D0) conditions, compared to 19% one month ago. There was a drastic change in drought conditions across the region in the past month. Drought coverage essentially ‘flipped’, from severe drought isolated to central and south Florida in June to drought now covering much of the northern parts of the Southeast including Virginia, the Carolinas, northern Alabama and Georgia, and central and eastern Tennessee.
- While recent rain events in early July led to some localized drought improvements, it has not been enough to halt the expansion of drought conditions, as much of that moisture is quickly absorbed by dry soils. Extreme Drought (D3) has emerged in North and South Carolina, the first time any part of the Coastal Plain has reached the D3 classification since August 2011.
- Rains from this past weekend brought considerable precipitation and drought relief to the eastern Carolinas and eastern Virginia.
- Additional information on current conditions are found on Drought.gov's Current Conditions page, or you can explore conditions at the state level.
Figure 1. 30-Day Percent of Normal Precipitation for the Southeast
Key Takeaway: Much of the Southeast experienced below-normal precipitation and worsening drought conditions between June 11 - July 12, while above-normal precipitation in Florida significantly improved drought conditions there.
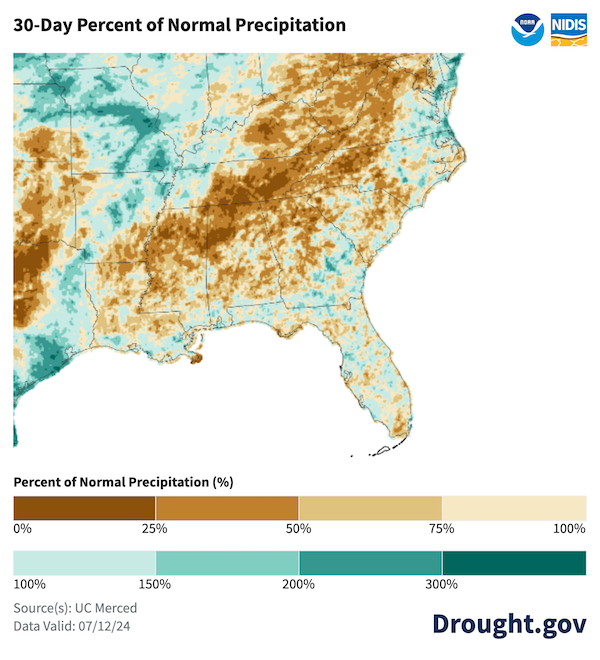
Figure 2. Statewide Precipitation Ranks for June 2024
Key Takeaway: The northern parts of the Southeast recorded some of their lowest recorded precipitation measurements, with Virginia having its driest June on record and North Carolina having its 2nd driest June on record.
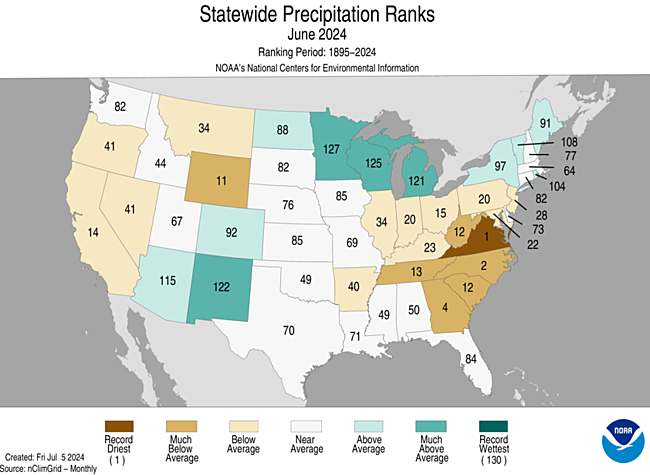
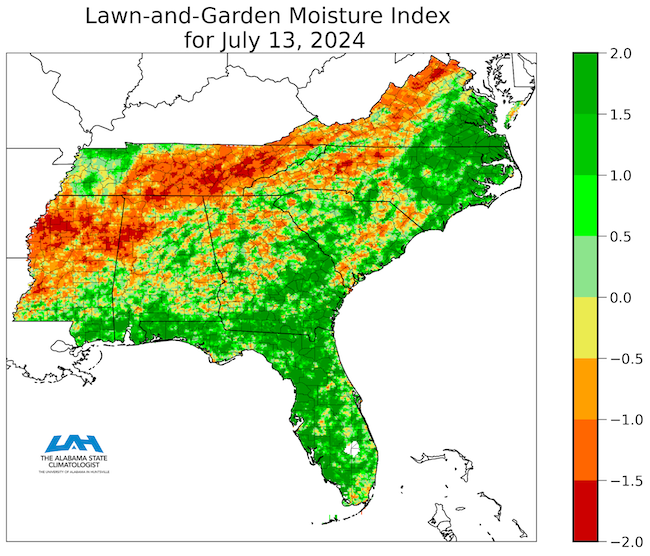
Figure 3. Lawn and Garden Moisture Index
Key Takeaway: Strong precipitation deficits led to reduced soil moisture across a large portion of the Southeast, including northern Alabama, eastern and central Tennessee, South Carolina, North Carolina, and Virginia. Recent rains in eastern North Carolina and southeastern Virginia have helped improve soil moisture conditions in these areas.
Drought Impacts to Crop Production and Streamflow Levels
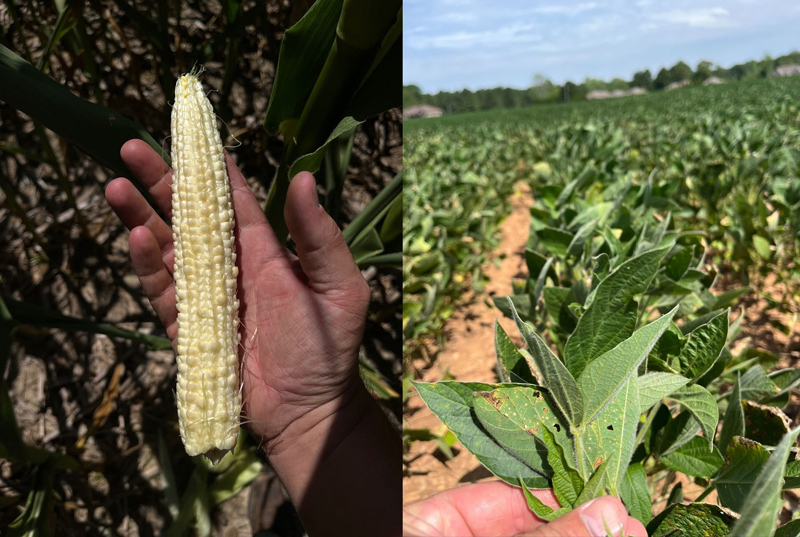
- Corn crops are in very poor condition as they are extremely sensitive to a lack of precipitation at the current pollination stage of growth. Additional loss is likely unavoidable, and some producers expected significant or near- total loss for corn. Crop damage for soybeans and peanuts is also reported.
- Cattle producers are feeding hay due to the lack of summer grass production. Crops that tend to be more drought tolerant, such as cotton and green sorghum, are also showing signs of damage.
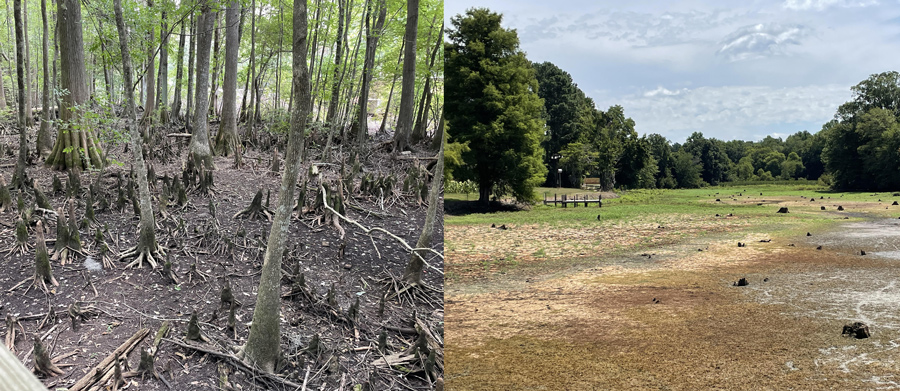
- Streamflow and groundwater measurements are nearing or at historic low levels in those areas most impacted.
- Reservoirs were less impacted due to the wet winter and spring, but levels could decline if conditions persist. The heat and limited rainfall are resulting in above normal peak summer demands for some water systems such as South Carolina, leading to the implementation of voluntary water restrictions.
- Additional impacts include elevated wildfire risk and fire activity, and some fishing closures in Virginia.
- Report conditions and any drought impacts you see or hear via the Condition Monitoring Observer Reports from the National Drought Mitigation Center.
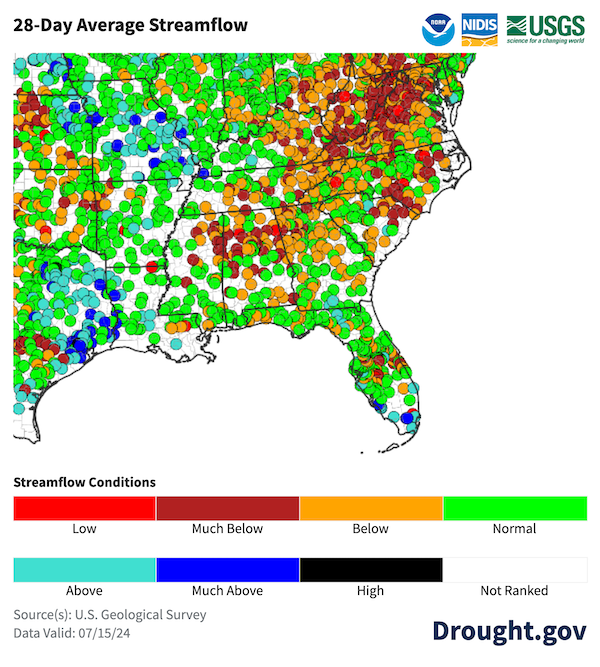
Figure 4. 28-Day Average Streamflow
Key Takeaway: Low streamflow rates are present across those areas in drought, especially in the Carolinas and Virginia.
Photos 1 and 2. Drought Stress on Corn and Soybean Crops
Photos 3 and 4. Low Water Levels in Pocataligo Swamp and Pudding Swamp, South Carolina
Looking Ahead: Additional Drought Relief Is Expected
- Recent rains this past weekend have brought much-needed moisture to the coastal Carolinas and southeast Virginia, and more rain is on the way over the next week for the northern part of the region. Additional drought improvement for much of the northern region is expected over the next week.
- Drought and its impacts may persist and possibly develop in new areas that do not receive enough rainfall to address precipitation deficits, such as western Tennessee.
- The localized nature of summertime storms may lead to differences in impacts across any given area.
- View additional outlook and forecast information.
Figure 5. 7 Day Precipitation Forecast for July 15 - July 22, 2024
Key Takeaway: A considerable amount of rainfall is expected over much of the Southeast region in the next week, with up to 4 inches or more in parts of the coastal Carolinas and southeast Virginia.
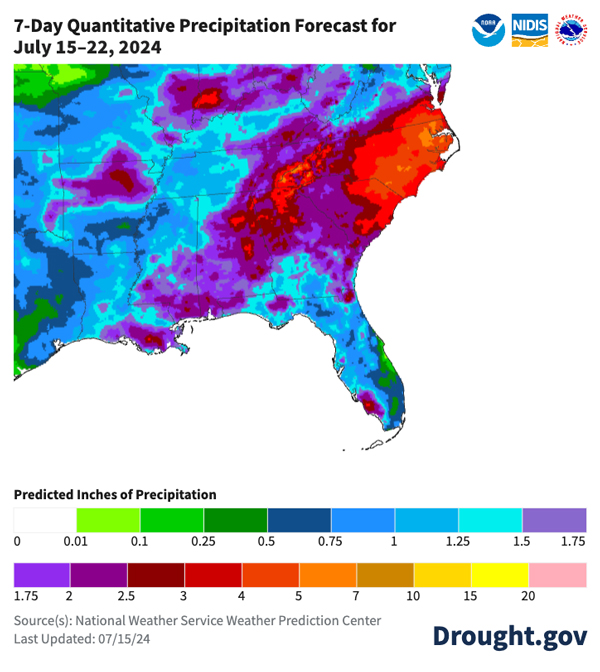
Figure 6. 8–14 Day Precipitation Outlook for July 22–28
Key Takeaway: There is a slightly above-normal chance of above-normal precipitation across much of the Southeast in the next two weeks, according to the Climate Prediction Center’s outlook for July 22–28.
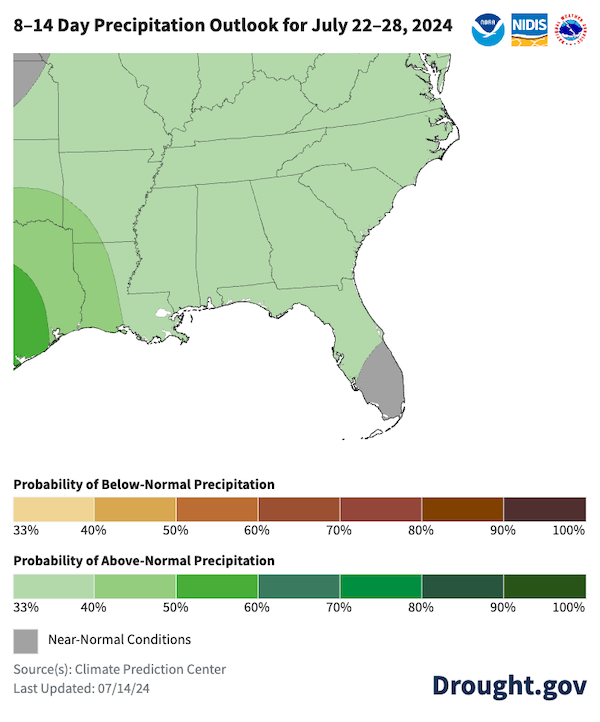
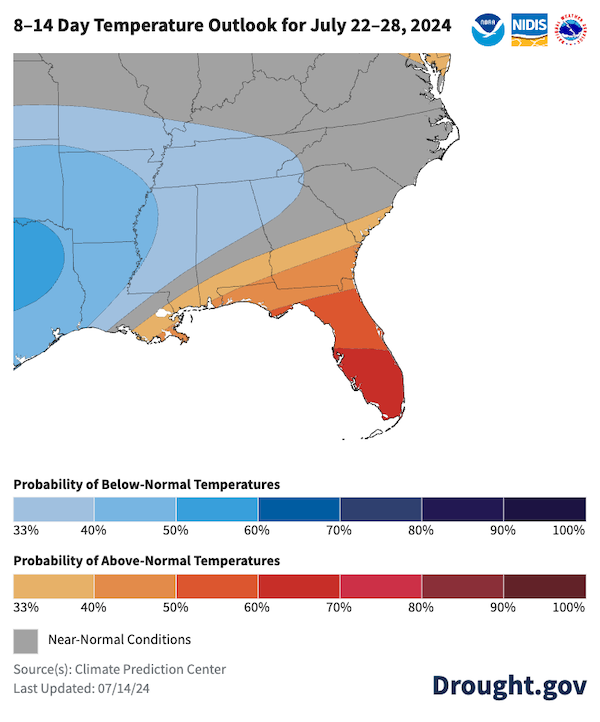
Figure 7. 8–14 Day Temperature Outlook for July 22–28
Key Takeaway: Over the next two weeks, temperature is expected to be below normal in the interior region and above normal in the Florida peninsula, especially in the southern part of the region.
Resources
Drought.gov State Pages
State pages on Drought.gov provide a one-stop shop for tailored state drought information and resources for each state. Find your state here. You can also find county and city-level information on Drought.gov.
Local National Weather Service Drought Information Statements
These NWS statements provide up-to-date reports on the current drought situation for regional Weather Forecast Offices' county warning and forecast area. Find a statement here. Current NWS statements in the Southeast DEWS include:
- Columbia, South Carolina (July 11)
- Huntsville, Alabama (July 12)
- Morristown, Tennessee (July 11)
- Blacksburg, Virginia (July 12)
- Raleigh, North Carolina (July 5)
State Resources
- Alabama: ADECA Drought Planning and Management; Office of the Alabama State Climatologist; Alabama Drought Reach
- Florida: Florida Climate Center; Florida Weekly Drought Summary
- Georgia: Georgia EPD Drought Management; Office of the Georgia State Climatologist
- North Carolina: North Carolina Drought Management Advisory Council; North Carolina State Climate Office
- South Carolina: South Carolina Drought Page; South Carolina State Climatology Office
- Tennessee: Tennessee Weekly Drought Summaries; Tennessee Climate Office
- Virginia: Virginia DEQ Drought Page
Prepared By
Meredith Muth
NOAA/National Integrated Drought Information System (NIDIS)
Victor Murphy and Chris Stachelski
NOAA’s National Weather Service
Lee Ellenburg
Alabama State Climate Office
Brianne Kendall Minton
Alabama Drought Reach, Auburn University
Elliot Wickham
South Carolina State Climatology Office
Klaus Albertin
North Carolina Department of Environmental Quality
Pam Knox
University of Georgia
Jonathan McGee
National Weather Service, Wakefield, VA
Nicholas Fillo
National Weather Service, Blacksburg, VA
This Drought Status Update is issued in partnership between the National Oceanic and Atmospheric Administration (NOAA) and partners to communicate a potential area of concern for drought expansion and/or development within the Southeast DEWS region based on recent conditions and the upcoming forecast. NIDIS and its partners will issue future Drought Status Updates as conditions evolve.
