Southern Plains Drought Likely to Persist and Expand Through Spring, but May Improve in Summer
Key Points
- On March 14, winds drove fires and dust storms across the Southern Plains, even in areas not currently impacted by drought.
- Exceptional Drought (D4) expanded to a larger area over the Texas Hill Country and the Big Bend region.
- Despite a short reprieve in the coming weeks, drought conditions are likely to persist through spring in these regions.
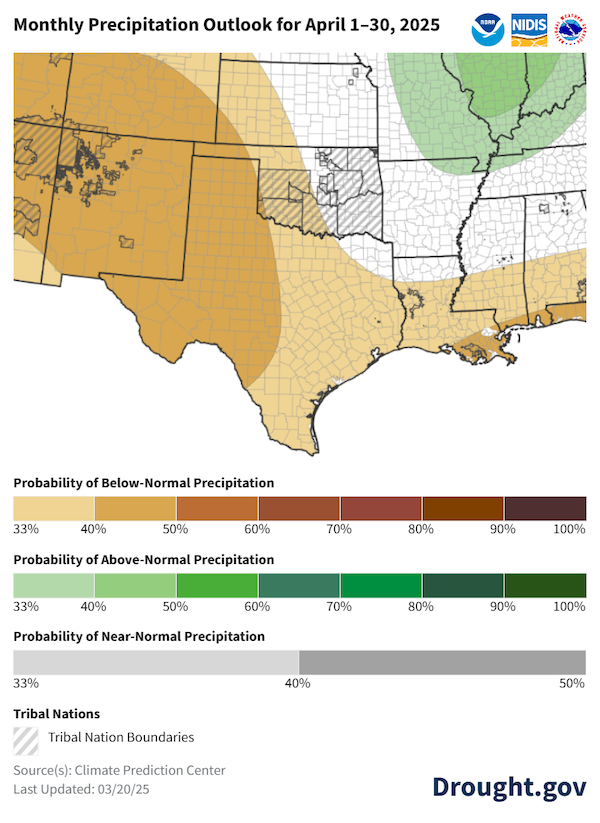
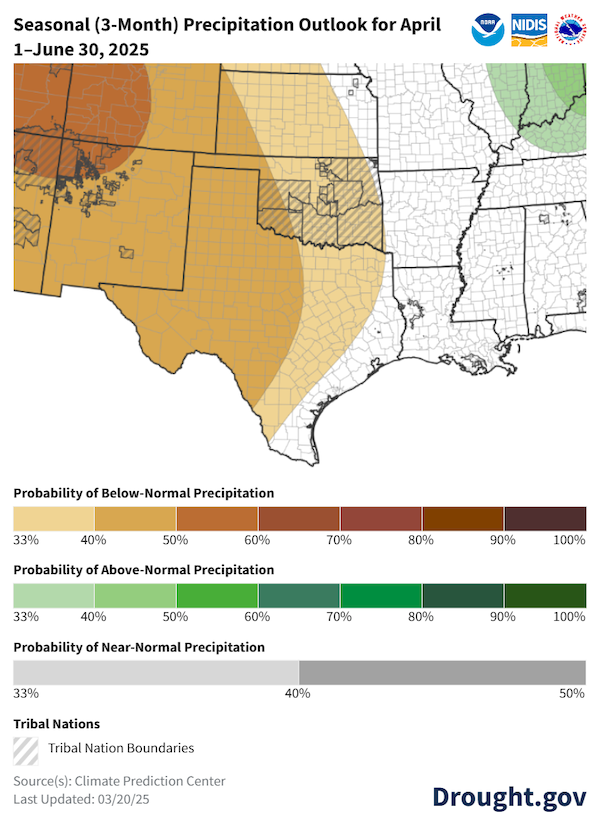
- Seasonal (April–June) outlooks show increased odds of below-normal precipitation (40-50% chance) and above-normal temperatures (50-70% chance) through June.
- May and June are climatologically wetter than other months of the year.
- Forecasts for El Niño–Southern Oscillation (ENSO) neutral conditions could indicate a shift away from dry conditions by summer.
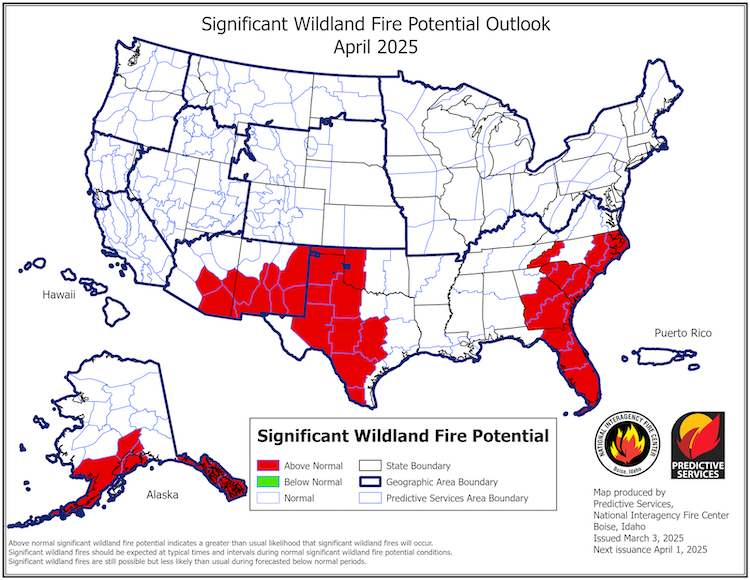
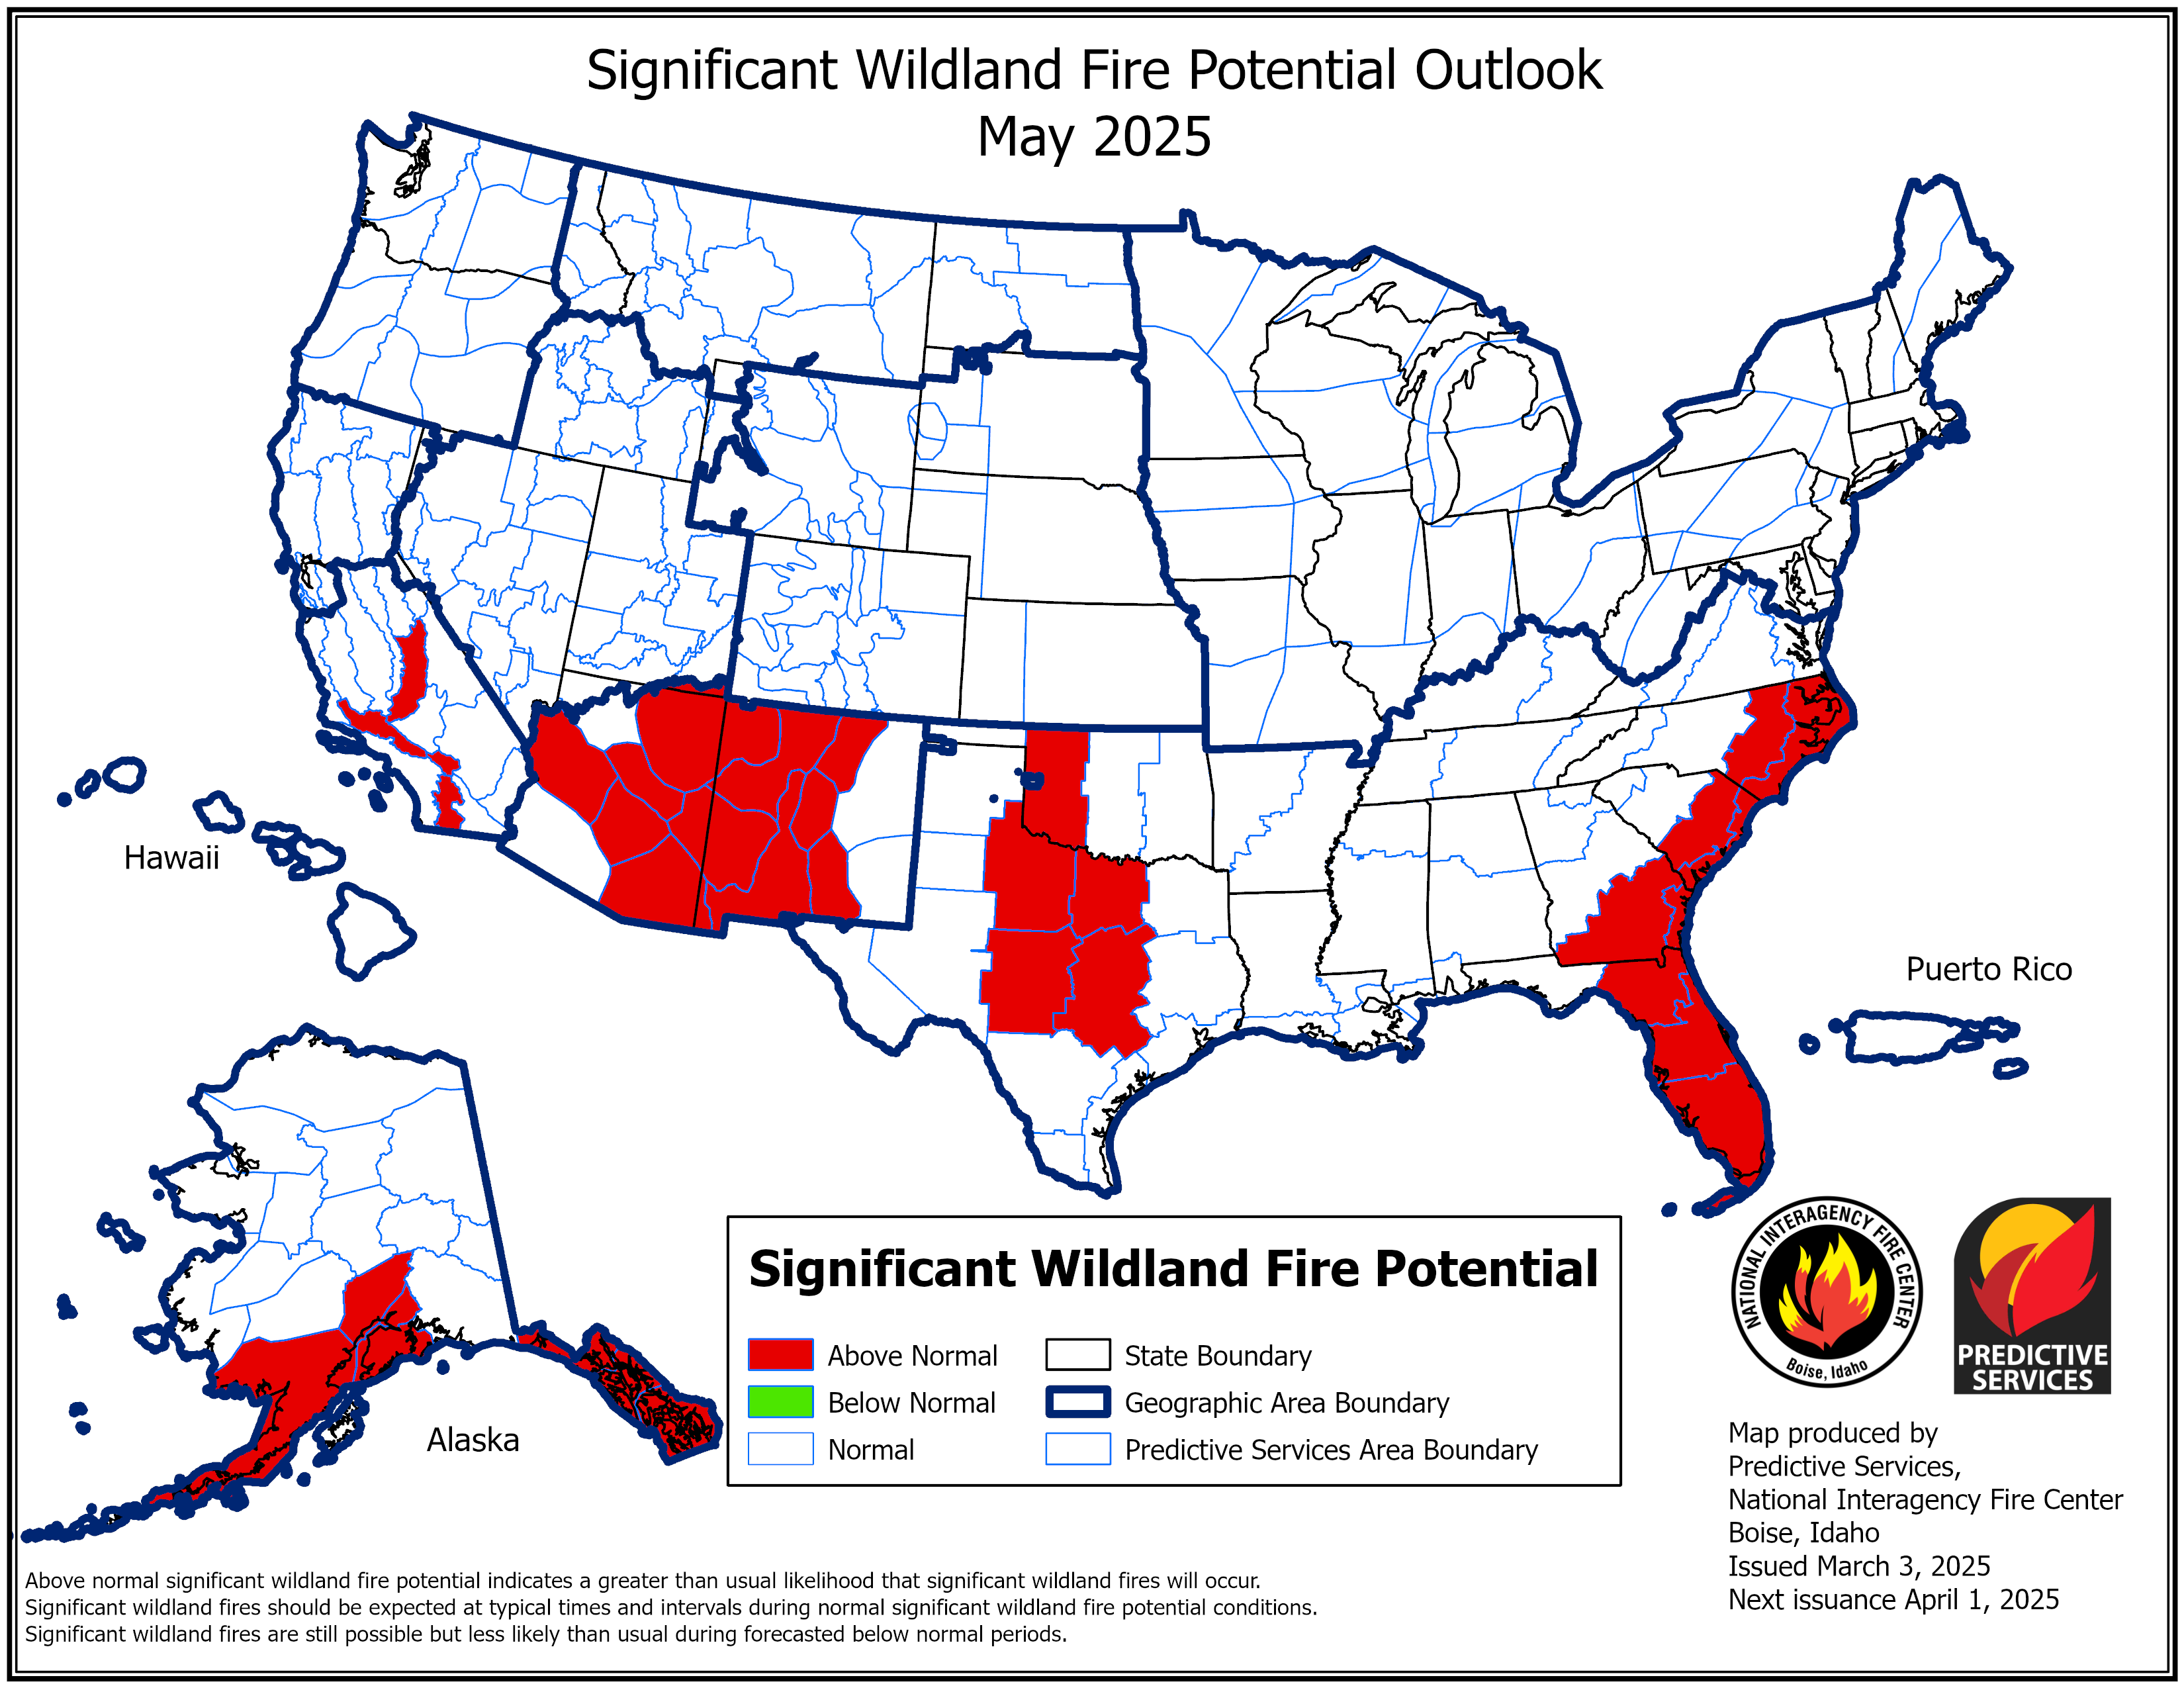
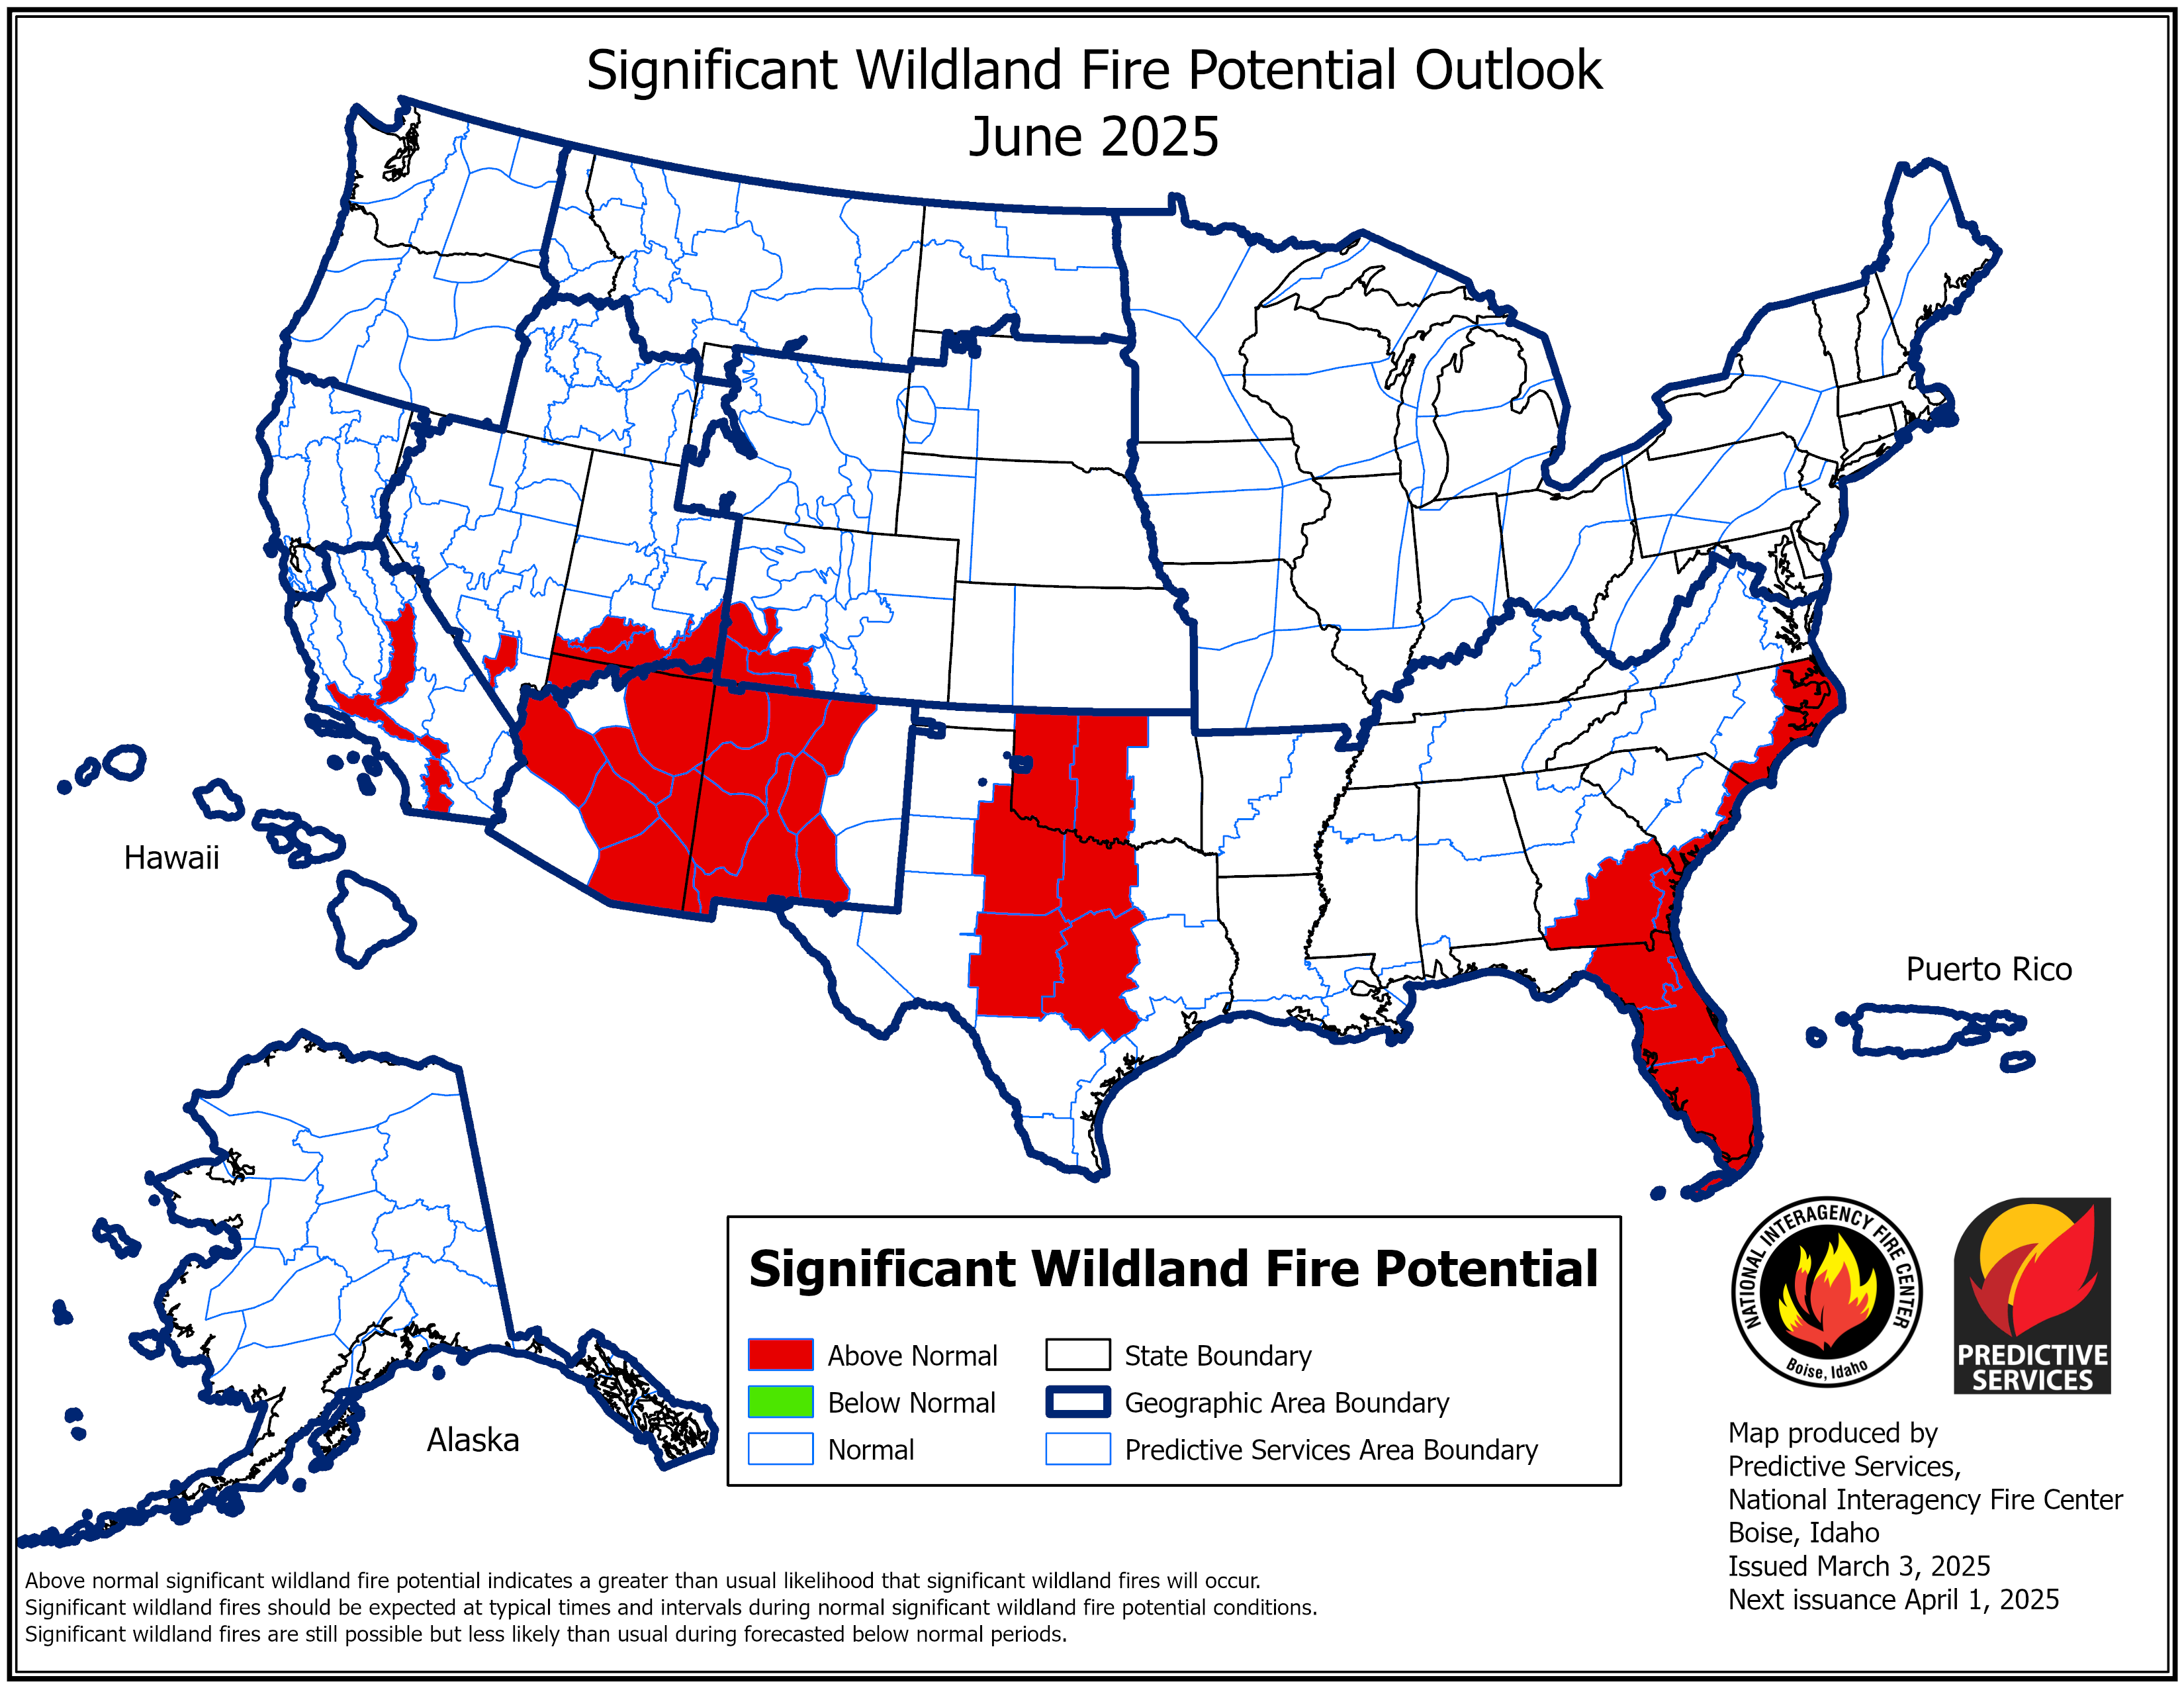
- Wildland fire potential is above normal for western and central Oklahoma and Texas through June.
This update is based on data available as of Thursday, March 27, 2025 at 9 a.m. CT. We acknowledge that conditions are evolving.
This NASA true-color image shows blowing dust, as well as fires & thermal anomalies (orange) from the NASA MODIS missions’ Terra and Aqua satellites, on Friday, March 14, 2025.
Drought is a compounding hazard that can escalate already hazardous weather, such as a wind storm, into a dust storm or a high fire danger situation. For the week of March 14-20, drought did exactly that across the Southern Plains.
The week included at least two major dust storms and hundreds of fires. Dust storms over western Kansas caused a deadly crash near Goodland, Kansas and closed a 130-mile stretch of Interstate 10 in New Mexico. Wildfires burned hundreds of thousands of acres and over 400 homes, barns, and businesses within Oklahoma, according to the Oklahoma Office of Emergency Management.
FIre and Thermal Anomalies
The Aqua and Terra MODIS Fire and Thermal Anomalies layer shows active fire detections and thermal anomalies, such as volcanoes, and gas flares.
This NASA true-color image shows blowing dust, as well as fires & thermal anomalies (orange) from the NASA MODIS missions’ Terra and Aqua satellites, on Friday, March 14, 2025.
Drought is a compounding hazard that can escalate already hazardous weather, such as a wind storm, into a dust storm or a high fire danger situation. For the week of March 14-20, drought did exactly that across the Southern Plains.
The week included at least two major dust storms and hundreds of fires. Dust storms over western Kansas caused a deadly crash near Goodland, Kansas and closed a 130-mile stretch of Interstate 10 in New Mexico. Wildfires burned hundreds of thousands of acres and over 400 homes, barns, and businesses within Oklahoma, according to the Oklahoma Office of Emergency Management.
This map is valid March 14, 2025. View the latest conditions on an interactive map from NASA Worldview.
Current Conditions and Impacts for the Southern Plains
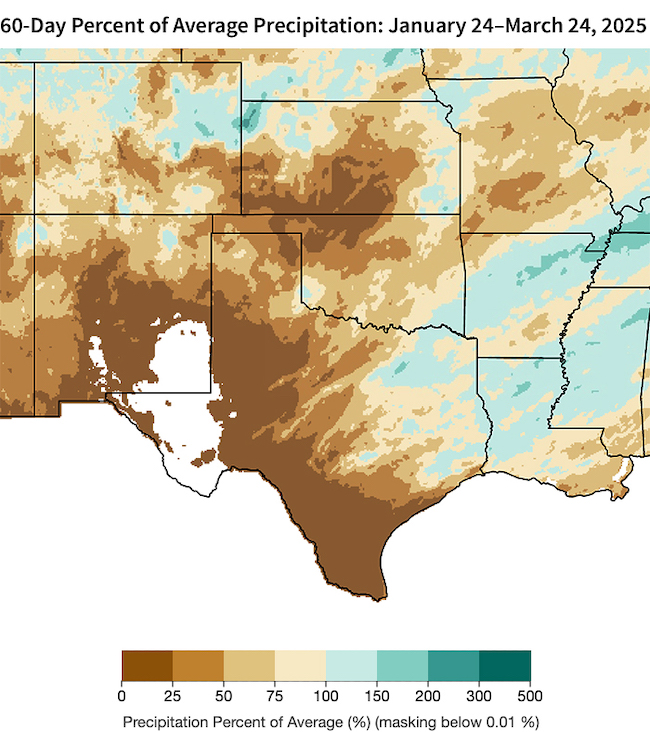
- February and March are typically dry months in the High Plains, but this year has been exceptionally dry.
- Exceptional Drought (D4) expanded to a larger area over the Texas Hill Country and the Big Bend region, according to the U.S. Drought Monitor.
- On March 26, the U.S. Department of Agriculture designated 86 Texas counties as natural disaster areas due to drought.
- Drought-induced impacts from March 14–20 wind storms include:
- Dust storms over western Kansas, which caused a deadly crash near Goodland Kansas and closed a 130-mile stretch of Interstate 10 in New Mexico.
- Wildfires burned 170,000 acres and over 400 homes, barns, and businesses within Oklahoma.
- There were 4 fire-related fatalities and over 200 injuries in Oklahoma, according to the Oklahoma Office of Emergency Management.
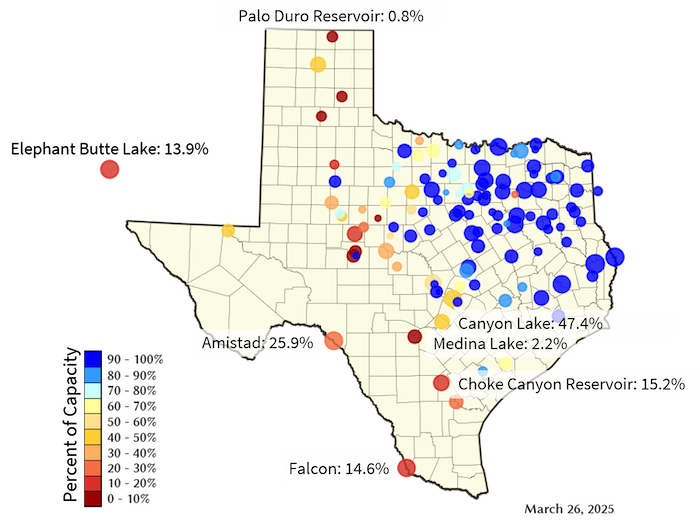
- Reservoirs across central and western Texas fell below 50% of capacity.
- Multi-year drought led to water restrictions and low groundwater in central Texas:
The Southern Plains Saw Below-Normal Precipitation Over the Past 60 Days
Multi-Year Drought Led to Low Reservoir Levels, Water Restrictions in Texas
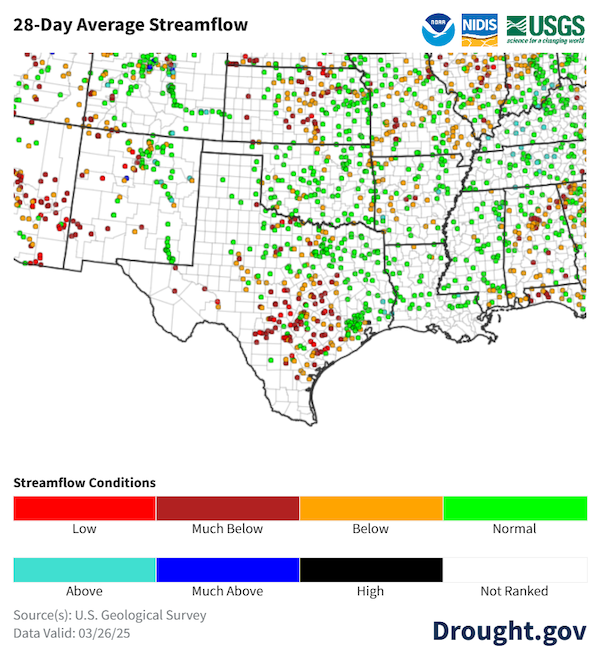
Streamflow in Central Texas and Central Kansas is Very Low for This Time of Year
Outlooks and Potential Impacts in the Southern Plains
- The Climate Prediction Center’s temperature outlooks show a high likelihood of above-normal temperatures at the 6–10 day, 8-14 day, monthly, and seasonal (April–June) scale. Above-average temperatures are forecast through June.
- March ended with a wet spell over central Texas, but the monthly and seasonal precipitation outlooks call for continued dry conditions through early summer.
- For the western part of the Southern Plains:
- April is usually still pretty dry, on average seeing less than 1.5 inches of rain for the month.
- May and June are usually considerably wetter as spring weather patterns develop.
- Summer monsoon rainfall can happen in late June, but is more common in July and August.
- Increased wildland fire potential will continue over western Texas, Oklahoma, and Kansas through spring.
La Niña Is Expected to End Soon
- A La Niña Advisory is in place, meaning La Niña conditions are observed.
- La Niña conditions—which likely contributed to the dry winter across Texas—are expected to transition to El Niño Southern Oscillation (ENSO) neutral during April or May 2025. ENSO-neutral means neither El Niño nor La Niña will drive summer weather patterns.
- As the La Niña pattern breaks down in spring, Texas drought may see some improvement with summertime precipitation. However, hydrologic drought in central Texas will need more than one good season to recover low surface and groundwater storage.
Despite Recent Rain, The Outlooks Call For Continued Dryness Through June
Above-Normal Wildland Fire Potential for April 2025
Resources
- Register for the upcoming Southern Plains Climate and Drought Webinar on April 24, 2025, 12 p.m. CT.
- Southern Regional Climate Center
- USDA Southern Plains Climate Hub
- South-Central Climate Adaptation Science Center
- More local information is available from the following resources:
- To report or view local drought impact information:
Prepared By
Joel Lisonbee
Cooperative Institute for Research in Environmental Sciences/University of Colorado, Boulder
NOAA’s National Integrated Drought Information System, Southern Plains Drought Early Warning System
John Nielsen-Gammon
Texas State Climate Office, Texas State Climate Office, Texas A&M University
Southern Regional Climate Center
Gary McManus
Oklahoma Climatological Survey, State Climatologist
This Drought Status Update is issued in partnership between the National Oceanic and Atmospheric Administration (NOAA) and and partners across the Southern Plains Drought Early Warning System to communicate a potential area of concern for drought expansion and/or development within the Southern Plains region based on recent conditions and the upcoming forecast. NIDIS and its partners will issue future Drought Status Updates as conditions evolve.

