Hot and Dry Summer Ahead for the Southern High Plains
Key Points:
- The seasonal outlook shows a hot and dry summer is likely for the southern High Plains.
- Flash drought (i.e., rapid drought intensification) developed over northern Oklahoma and central Kansas in April.
- Extreme Drought (D3) returned to central Kansas.
- Areas along the Rio Grande are experiencing hydrologic drought, meaning water supplies are low.
- The Rio Grande Valley has experienced extraordinary heat in May, with several locations setting maximum temperature records.
The U.S. Drought Monitor depicts the location and intensity of drought across the country. The map uses 5 classifications: Abnormally Dry (D0), showing areas that may be going into or are coming out of drought, and four levels of drought (D1–D4).
Key Takeaway: Moderate to Severe Drought (D1–D2) persists over western Kansas, Oklahoma, and Texas, with continued Extreme to Exceptional Drought (D3–D4) over far west Texas.
The U.S. Drought Monitor depicts the location and intensity of drought across the country. This historical timeseries shows the progression of drought & dryness across Kansas, Texas, and Oklahoma from 2000 to the present, as a percent of total land area.
A drought index combines multiple drought indicators (e.g., precipitation, temperature, soil moisture) to depict drought conditions. For some products, like the U.S. Drought Monitor, authors combine their analysis of drought indicators with input from local observers. Other drought indices, like the Standardized Precipitation Index (SPI), use an objective calculation to describe the severity, location, timing, and/or duration of drought.
Learn MorePeriods of drought can lead to inadequate water supply, threatening the health, safety, and welfare of communities. Streamflow, groundwater, reservoir, and snowpack data are key to monitoring and forecasting water supply.
Learn MoreDrought can reduce the water availability and water quality necessary for productive farms, ranches, and grazing lands, resulting in significant negative direct and indirect economic impacts to the agricultural sector. Monitoring agricultural drought typically focuses on examining levels of precipitation, evaporative demand, soil moisture, and surface/groundwater quantity and quality.
Learn MoreA drought index combines multiple drought indicators (e.g., precipitation, temperature, soil moisture) to depict drought conditions. For some products, like the U.S. Drought Monitor, authors combine their analysis of drought indicators with input from local observers. Other drought indices, like the Standardized Precipitation Index (SPI), use an objective calculation to describe the severity, location, timing, and/or duration of drought.
Learn MorePeriods of drought can lead to inadequate water supply, threatening the health, safety, and welfare of communities. Streamflow, groundwater, reservoir, and snowpack data are key to monitoring and forecasting water supply.
Learn MoreDrought can reduce the water availability and water quality necessary for productive farms, ranches, and grazing lands, resulting in significant negative direct and indirect economic impacts to the agricultural sector. Monitoring agricultural drought typically focuses on examining levels of precipitation, evaporative demand, soil moisture, and surface/groundwater quantity and quality.
Learn MoreU.S. Drought Monitor Categories
Abnormally Dry (D0)
Abnormally Dry (D0) indicates a region that is going into or coming out of drought. View typical impacts by state.
Moderate Drought (D1)
Moderate Drought (D1) is the first of four drought categories (D1–D4), according to the U.S. Drought Monitor. View typical impacts by state.
Severe Drought (D2)
Severe Drought (D2) is the second of four drought categories (D1–D4), according to the U.S. Drought Monitor. View typical impacts by state.
Extreme Drought (D3)
Extreme Drought (D3) is the third of four drought categories (D1–D4), according to the U.S. Drought Monitor. View typical impacts by state.
Exceptional Drought (D4)
Exceptional Drought (D4) is the most intense drought category, according to the U.S. Drought Monitor. View typical impacts by state.
Total Area in Drought (D1–D4)
Percent area of the Southern Plains that is currently in drought (D1–D4), according to the U.S. Drought Monitor.
U.S. Drought Monitor Categories
Abnormally Dry (D0)
Abnormally Dry (D0) indicates a region that is going into or coming out of drought. View typical impacts by state.
Moderate Drought (D1)
Moderate Drought (D1) is the first of four drought categories (D1–D4), according to the U.S. Drought Monitor. View typical impacts by state.
Severe Drought (D2)
Severe Drought (D2) is the second of four drought categories (D1–D4), according to the U.S. Drought Monitor. View typical impacts by state.
Extreme Drought (D3)
Extreme Drought (D3) is the third of four drought categories (D1–D4), according to the U.S. Drought Monitor. View typical impacts by state.
Exceptional Drought (D4)
Exceptional Drought (D4) is the most intense drought category, according to the U.S. Drought Monitor. View typical impacts by state.
The U.S. Drought Monitor depicts the location and intensity of drought across the country. The map uses 5 classifications: Abnormally Dry (D0), showing areas that may be going into or are coming out of drought, and four levels of drought (D1–D4).
Key Takeaway: Moderate to Severe Drought (D1–D2) persists over western Kansas, Oklahoma, and Texas, with continued Extreme to Exceptional Drought (D3–D4) over far west Texas.
The U.S. Drought Monitor depicts the location and intensity of drought across the country. This historical timeseries shows the progression of drought & dryness across Kansas, Texas, and Oklahoma from 2000 to the present, as a percent of total land area.
The U.S. Drought Monitor is updated weekly on Thursday mornings, with data valid through the previous Tuesday at 7 a.m. ET.
The U.S. Drought Monitor is updated weekly on Thursday mornings, with data valid through the previous Tuesday at 7 a.m. ET. This Drought.gov Historical Data & Conditions Tool is also updated weekly.
A drought index combines multiple drought indicators (e.g., precipitation, temperature, soil moisture) to depict drought conditions. For some products, like the U.S. Drought Monitor, authors combine their analysis of drought indicators with input from local observers. Other drought indices, like the Standardized Precipitation Index (SPI), use an objective calculation to describe the severity, location, timing, and/or duration of drought.
Learn MorePeriods of drought can lead to inadequate water supply, threatening the health, safety, and welfare of communities. Streamflow, groundwater, reservoir, and snowpack data are key to monitoring and forecasting water supply.
Learn MoreDrought can reduce the water availability and water quality necessary for productive farms, ranches, and grazing lands, resulting in significant negative direct and indirect economic impacts to the agricultural sector. Monitoring agricultural drought typically focuses on examining levels of precipitation, evaporative demand, soil moisture, and surface/groundwater quantity and quality.
Learn MoreA drought index combines multiple drought indicators (e.g., precipitation, temperature, soil moisture) to depict drought conditions. For some products, like the U.S. Drought Monitor, authors combine their analysis of drought indicators with input from local observers. Other drought indices, like the Standardized Precipitation Index (SPI), use an objective calculation to describe the severity, location, timing, and/or duration of drought.
Learn MorePeriods of drought can lead to inadequate water supply, threatening the health, safety, and welfare of communities. Streamflow, groundwater, reservoir, and snowpack data are key to monitoring and forecasting water supply.
Learn MoreDrought can reduce the water availability and water quality necessary for productive farms, ranches, and grazing lands, resulting in significant negative direct and indirect economic impacts to the agricultural sector. Monitoring agricultural drought typically focuses on examining levels of precipitation, evaporative demand, soil moisture, and surface/groundwater quantity and quality.
Learn MoreCurrent Conditions for the Southern Plains
- A dry February through April resulted in flash drought development (i.e., rapid drought intensification) in central and western Kansas and western Oklahoma.
- Dodge City had 0.02 inches of rain in April, which ties 1909 as the driest April on record. With a combined 2-month total rainfall of only 0.27 inches, Dodge City, Kansas, had its driest March–April on record.
- South Texas Heatwave: May 9 was one of the hottest days ever recorded in the Rio Grande Valley. New May maximum temperature records were set at:
- McAllen, Texas, 111°F. The previous record was 110°F on May 4, 1999. McAllen tied an all-time station record from June 22, 2017.
- Harlingen, Texas, 107°F. The previous record was 105°F on May 12, 1974.
- Brownsville, Texas, 104°F. The previous record was 102°F on May 22, 1916; May 11, 1974; and May 5, 1999.
- Del Rio, Texas, 109°F. Tied the previous record set on May 24, 2000.
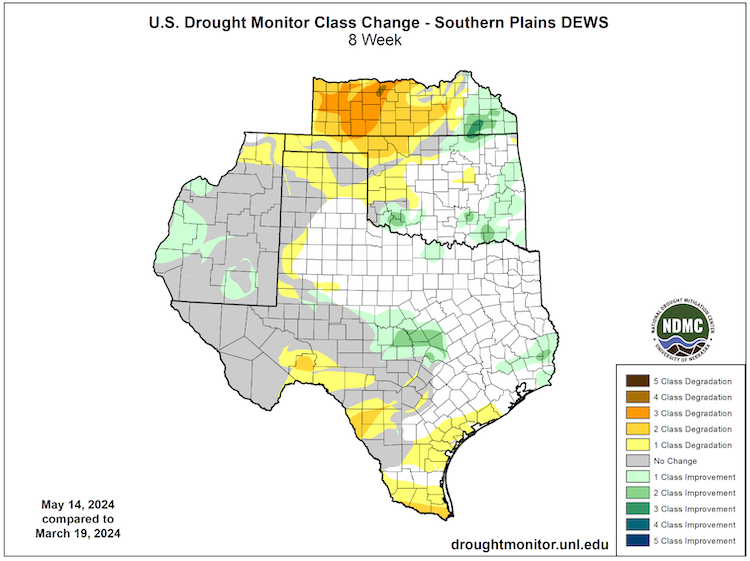
2-Month U.S. Drought Monitor Change Map (Since March 19, 2024)
Key Takeaway: Central Kansas experienced a four-category degradation in drought conditions over the 8 weeks from March 19 to May 14. Parts of northern Oklahoma also saw rapid intensification of drought over the same period, with a two-category degradation.
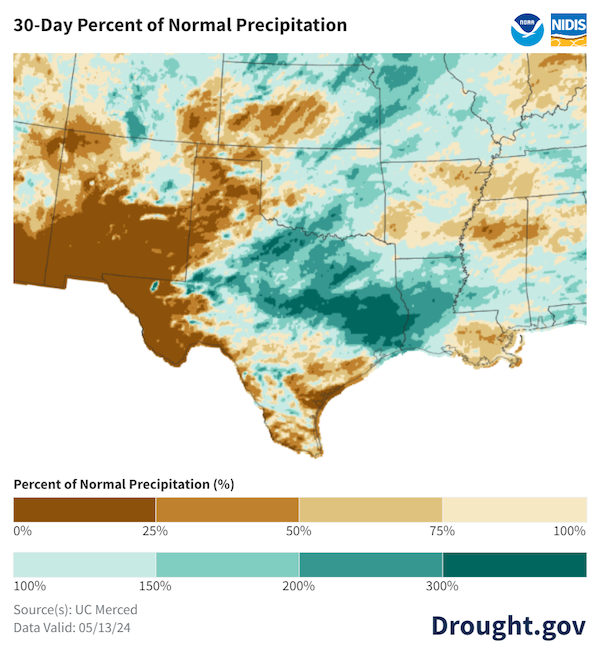
30-Day Percent of Normal Precipitation for the Southern Plains
Key Takeaway: Most of Texas, Oklahoma, and Kansas usually receive between 10%–15% of their annual precipitation in May. (The primary exception is the Upper Rio Grande region of far west Texas, which is usually very dry in the months before the onset of the Southwest Monsoon). For places like Dodge City, Kansas, this is usually between 3 and 3.5 inches of precipitation. Dodge City received only 0.84 inches of rainfall over the last 30 days and has not yet exceeded 3 inches of rainfall for the year to date.
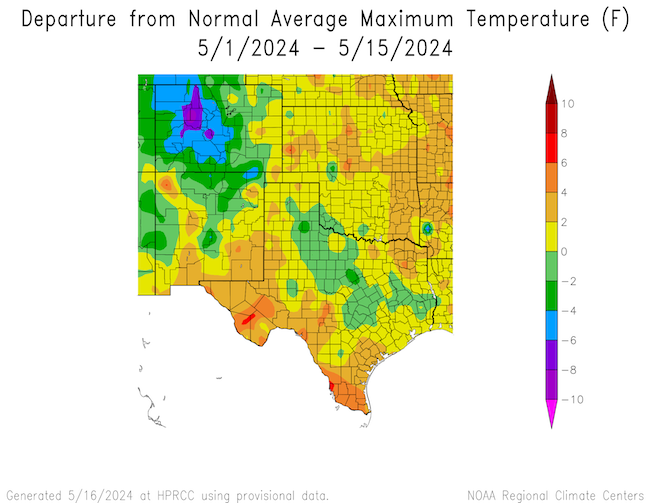
May-to-Date Departure from Normal Maximum Temperature
Key Takeaway: Early May has been exceptionally hot across southern Texas, setting new temperature records. Drought has developed or intensified in that part of the region.
Southern Plains Drought Impacts
- Lower Rio Grande water shortages:
- Drought puts a strain on the U.S.-Mexico water treaty.
- Cities along the lower Rio Grande enacted drought declarations and water restrictions:
- A dry February through April resulted in subsoil drying and led to poor wheat growth in central and western Kansas and western Oklahoma.
- The winter wheat crop in Kansas has been rated very poor for the fourth straight week, according to the U.S. Department of Agriculture.
- In several central Kansas counties, the last decent precipitation for the wheat came on February 5.
- A dry spell of 80 to 105 days affected wheat in northwest Oklahoma. For most of northwest Oklahoma, the dry spell lasted from February 5 to May 12.
Report your local drought impacts through a Condition Monitoring Observer Report:
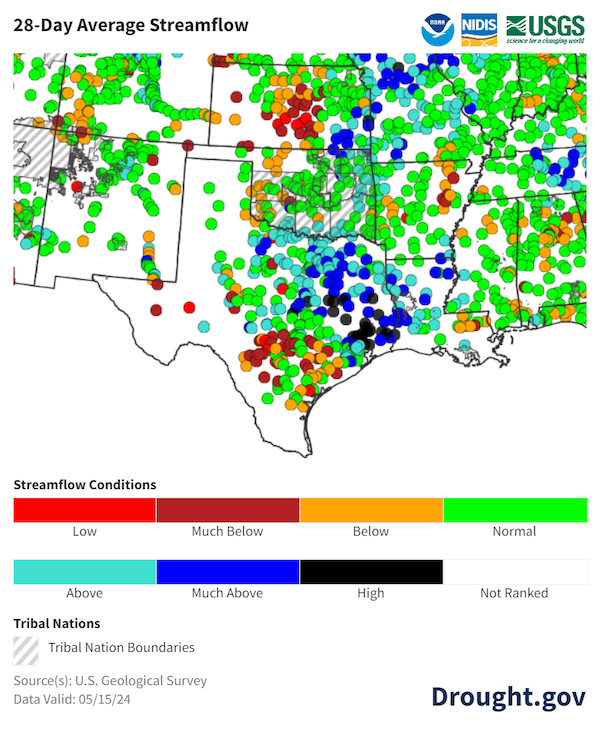
28-Day Average Streamflow Conditions (Valid May 13, 2024)
Key Takeaway: Meteorological drought over northern Oklahoma and central Kansas since February has curtailed streamflow and led to hydrologic drought conditions, with the most severe conditions in south-central Kansas. South Texas, especially the Hill Country, is seeing the impacts of persistent (100+ weeks) drought, including much below average streamflow.
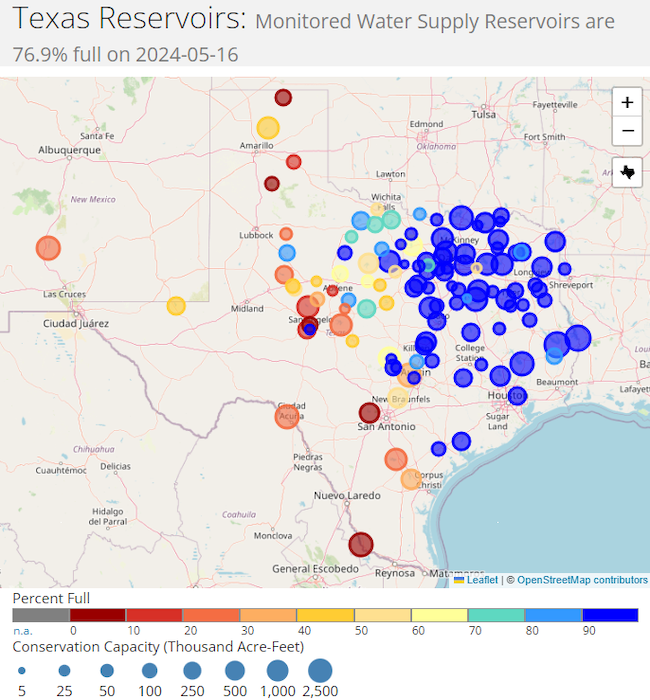
Texas Reservoir Levels
Key Takeaway: Reservoir levels in eastern Texas improved over the past two months, while reservoir levels in central and southern Texas remained low. A few notable reservoirs in drought status are:
- Falcon Reservoir, Rio Grande: 9.4% full
- Amistad Reservoir, Rio Grande: 27.9 % full
- Medina Lake, Medina River: 2.7% full
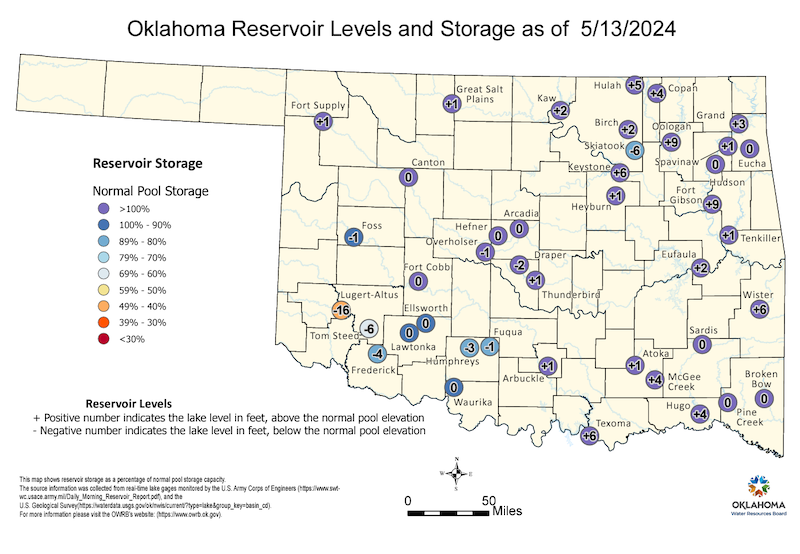
Oklahoma Reservoir Levels
Key Takeaway: Most reservoirs in northeastern Oklahoma are generally 90+% full, while most reservoirs in the southwestern part of the state are less than 80% full.
Outlooks and Potential Impacts for the Southern Plains
- The summer months (June-July-August) are usually the wettest time of the year for Southern Plains states, especially for the western part of the region that can usually pick up some rainfall from the Southwest Monsoon.
- The latest monthly and seasonal climate outlooks show:
- A hot and dry summer is ahead for the western parts of the Southern Plains that usually expect monsoonal rainfall.
- A warm and wet summer for the eastern part of the region, including the Gulf Coast.
- El Niño is on the way out. La Niña is on deck.
- El Niño weakened significantly over the last few months, which is typical in spring months.
- Early summer will be governed by a neutral pattern (neither El Niño nor La Niña), which means that this climate pattern is not driving weather patterns in early summer.
- A La Niña pattern is likely to develop by mid- to late-summer and will last through winter. La Niña usually, but not always, correlates with a wetter and cooler summer for southern Texas, but a drier summer for the rest of the Southern Plains (with no strong influence on temperatures).
- Looking further ahead, La Niña usually, but not always, correlates with a drier winter for the southern U.S.
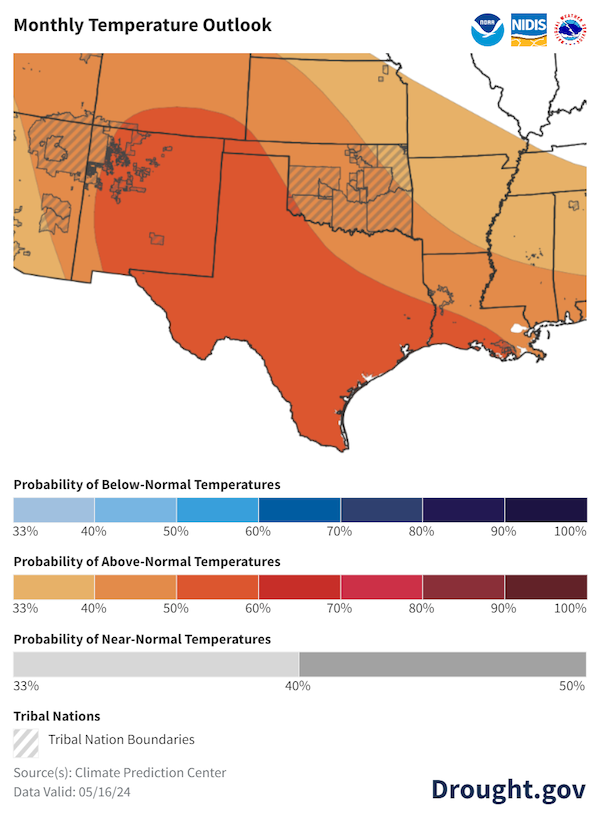
June 2024 Temperature Outlook
Key Takeaway: Odds favor above-normal temperatures for all of the Southern Plains DEWS region for June, with the highest odds for Texas.
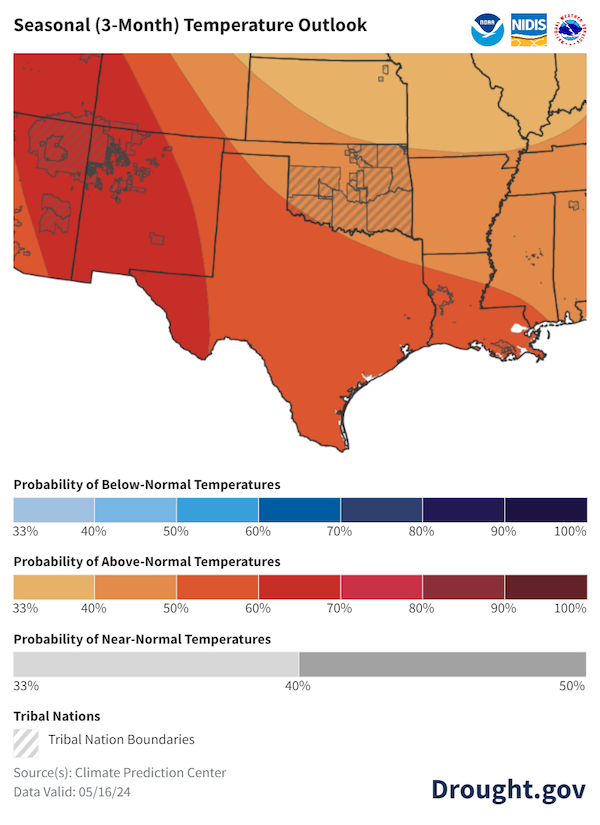
Seasonal (3-Month) Temperature Outlook: Summer (June–August) 2024
Key Takeaway: A warmer-than-normal summer is likely for the Southern Plains DEWS Region. Highest odds (60%-70% chance) of a warmer-than-normal summer are over the Upper Rio Grande region of western Texas.
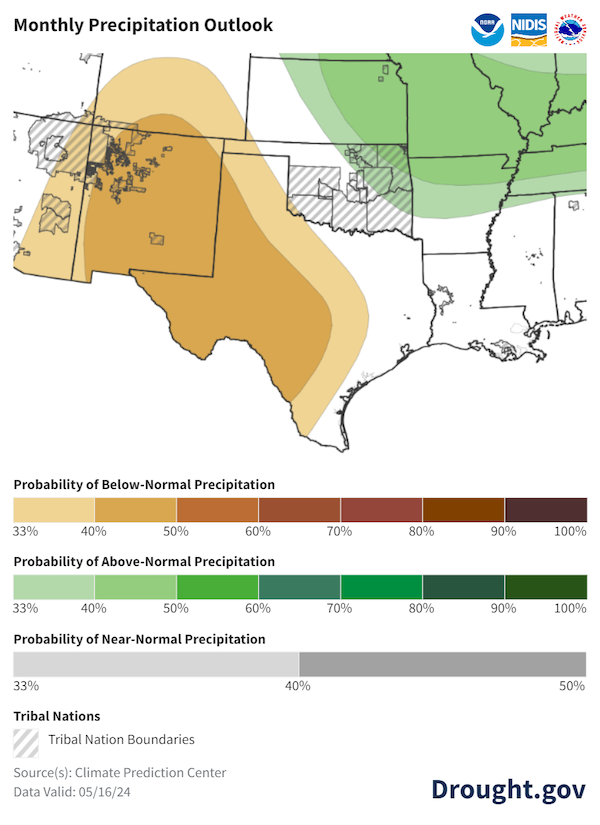
June 2024 Precipitation Outlook
Key Takeaway: June in the Southern Plains can possibly expect (33%–50% chance) below normal precipitation for western and central Texas, but odds slightly favor (33%-50% chance) above normal precipitation for eastern Kansas and northeast Oklahoma.
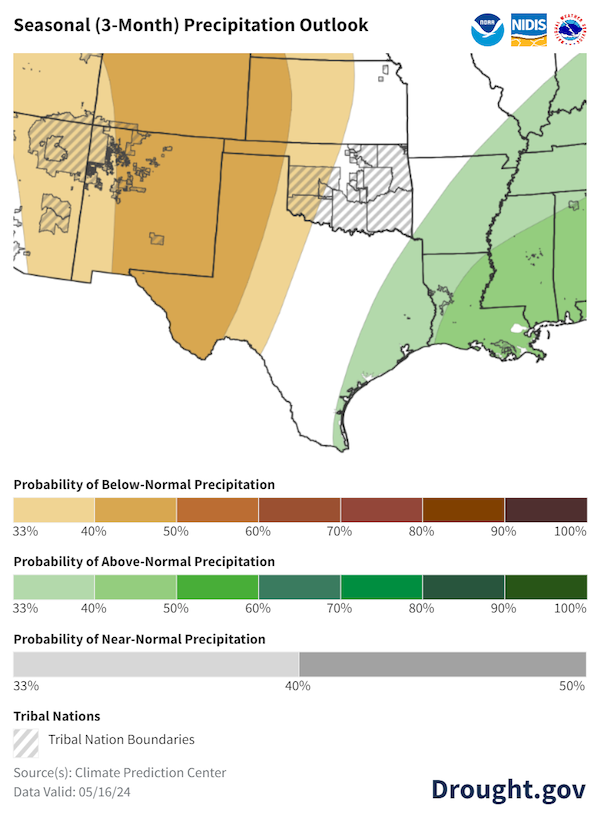
Seasonal (3-Month) Precipitation Outlook: Summer (July–August) 2024
Key Takeaway: The latest precipitation outlook shows lower-than-normal precipitation from the Southwest Monsoon this summer. This extends into far western Kansas, Texas, and the Oklahoma panhandle (33%–40% chance). The eastern U.S., including the Gulf Coast region of Texas, can likely (33%-40% chance) expect a wetter-than-normal summer.
Southern Plains Drought Resources
Regional Resources
- Southern Regional Climate Center
- Water Data for Texas
- Oklahoma Mesonet
- National Weather Service Drought Information Statements
Upcoming Events
- May 20, 2024 and May 24, 2024: Southern Plains Drought Assessment Virtual Meetings
In Case You Missed It
- April 16, 2024: Oklahoma Climate Webinar
Prepared By
Joel Lisonbee, Adam Lang, Kelsey Satalino, and Eleanor Hasenbeck
CIRES/CU Boulder and NOAA’s National Integrated Drought Information System, Southern Plains Drought Early Warning System
Gary McManus
Oklahoma State Climatologist, Oklahoma Mesonet, Oklahoma Climatological Survey
Matthew Sittel
Kansas Assistant State Climatologist, Kansas State University
John Nielsen-Gammon
Texas State Climatologist, Texas State Climate Office, Texas A&M University
Southern Regional Climate Center
William (BJ) Baule and Alison Tarter
Texas State Climate Office, Texas A&M University
Southern Regional Climate Center
Victor Murphy
National Weather Service
This Drought Status Update is issued in partnership between the National Oceanic and Atmospheric Administration (NOAA) and the State Climate Offices in Kansas, Oklahoma and Texas to communicate a potential area of concern for drought expansion and/or development within the Southern Plains region based on recent conditions and the upcoming forecast. NIDIS and its partners will issue future Drought Status Updates as conditions evolve.