The Southwest monsoon is coming. Please be better than last year!
Key Points
- Exceptional drought covers over 50% of the Intermountain West.
- Short-term outlooks indicate that the Southwest monsoon may begin by early July.
- Longer-term outlooks show equal chances of above- or below-normal monsoon rainfall this season.
- Higher than normal temperatures and high wildfire risk are expected through summer.
Current U.S. Drought Monitor map for the Intermountain West Drought Early Warning System region with data valid for June 22, 2021. The U.S. Drought Monitor is updated each Thursday to show the location and intensity of drought across the country.
Extreme (D3) to Exceptional (D4) drought persists across much of the Intermountain West.
U.S. Drought Monitor Categories
Current U.S. Drought Monitor map for the Intermountain West Drought Early Warning System region with data valid for June 22, 2021. The U.S. Drought Monitor is updated each Thursday to show the location and intensity of drought across the country.
Extreme (D3) to Exceptional (D4) drought persists across much of the Intermountain West.
Recent and Current Conditions
U.S. Drought Monitor Conditions
- Over half (57%) of the combined Intermountain West region is in Extreme (D3) to Exceptional (D4) drought.
- Extreme (D3) drought conditions have been in place in this region since May 2020.
- The extent of Exceptional (D4) drought in the Intermountain West reached a peak of 45% area in December 2020, a new record for the region.
- Moderate (D1) or worse drought has been in the region since August 2009.
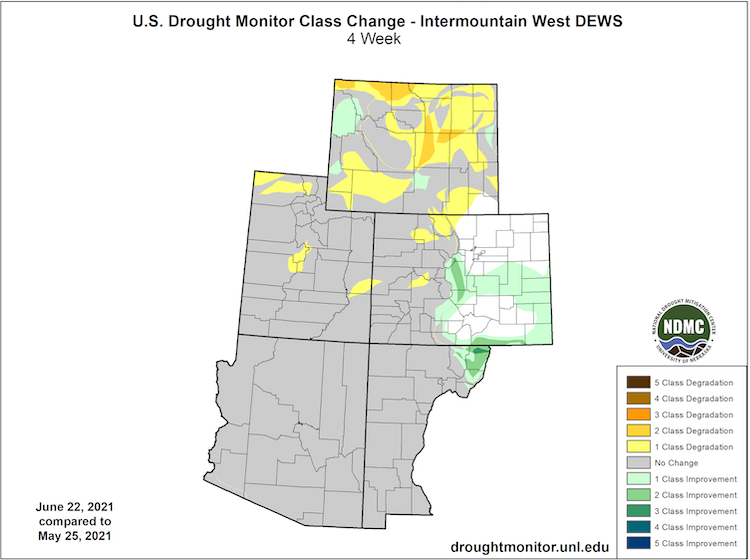
U.S. Drought Monitor 1-Month Change Map
- Southeastern Colorado and northeastern New Mexico have seen a 1- to 3-category drought improvement over 1 month.
- Drought conditions have remained or deteriorated across the rest of the region.
State Drought Plans, Declarations, or States of Emergency in Effect
| Arizona | Colorado | New Mexico | Utah |
|---|---|---|---|
| Drought declaration from 2007 that has not been rescinded | State Drought Mitigation and Response Plan shifted from Phase 2 to Phase 3 (full activation) on November 30, 2020 | Drought declaration and activation of the State Drought Task Force, December 9, 2020 | Drought state of emergency issued on March 17, 2021 |
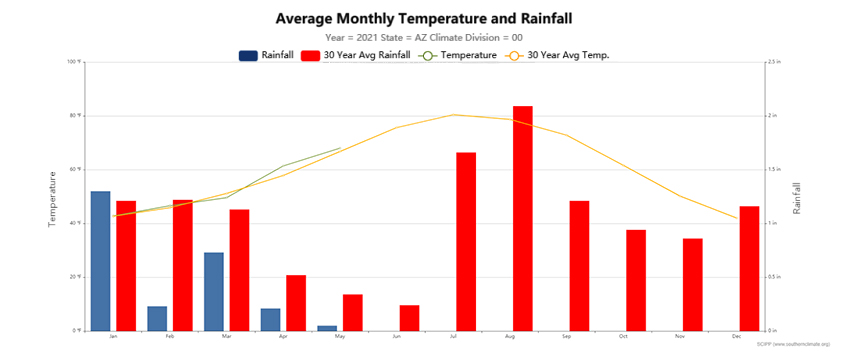
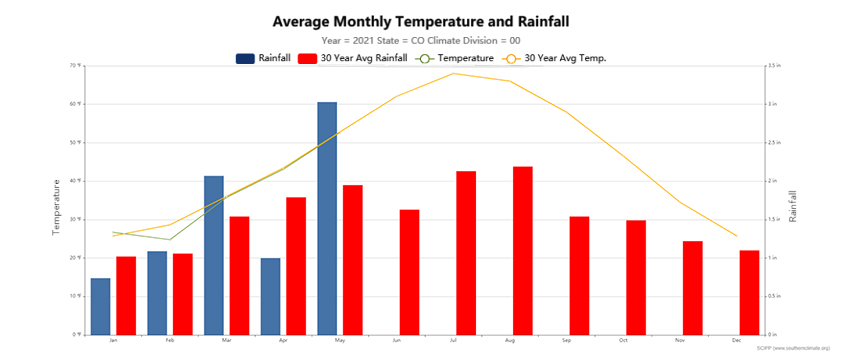
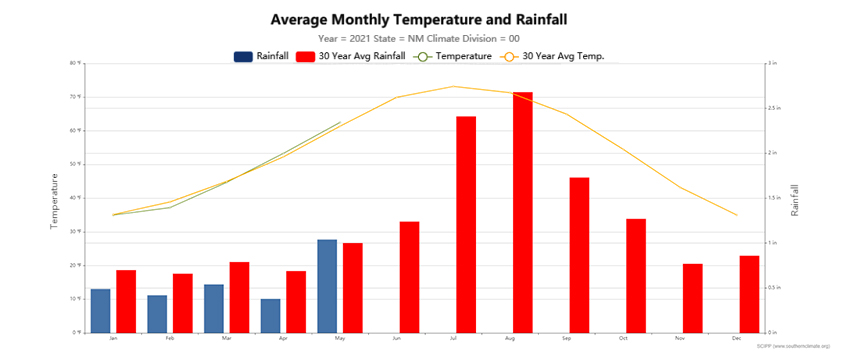
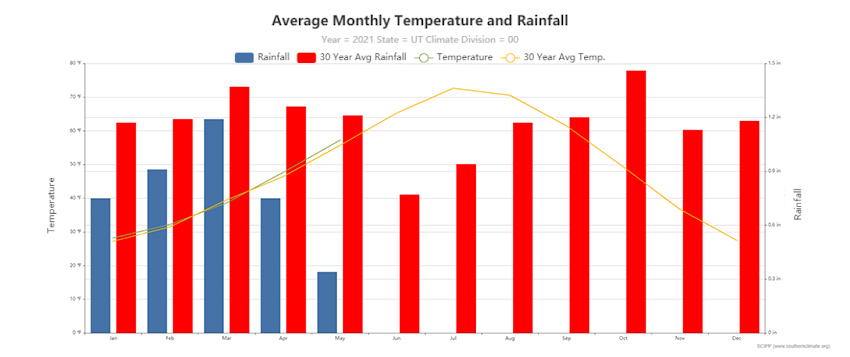
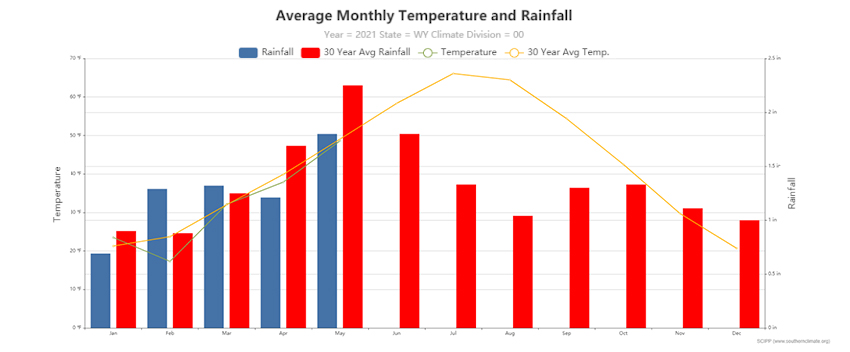
2021 Precipitation So Far
- June is typically the driest month of the year for Arizona and Utah.
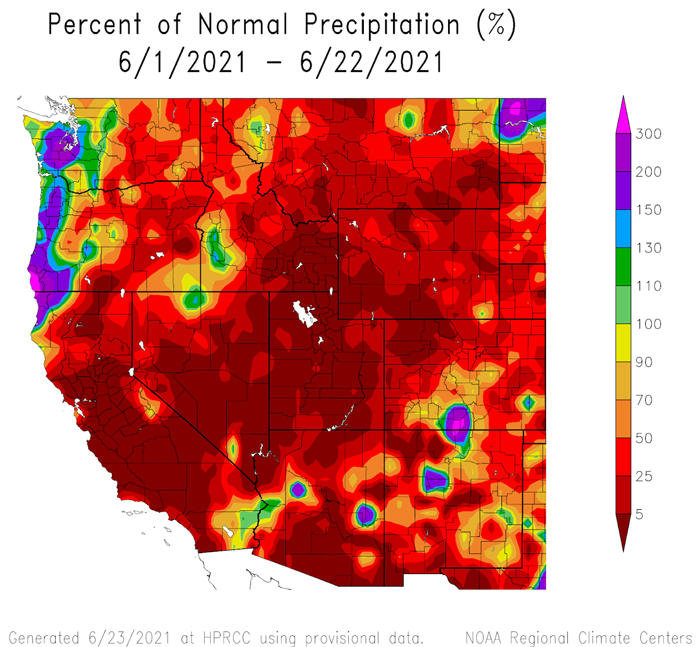
- Annual precipitation-to-date has been below average for all Intermountain West states, except Colorado, although Colorado precipitation has primarily focused in the eastern half of the state.
Arizona
Colorado
New Mexico
Utah
Wyoming
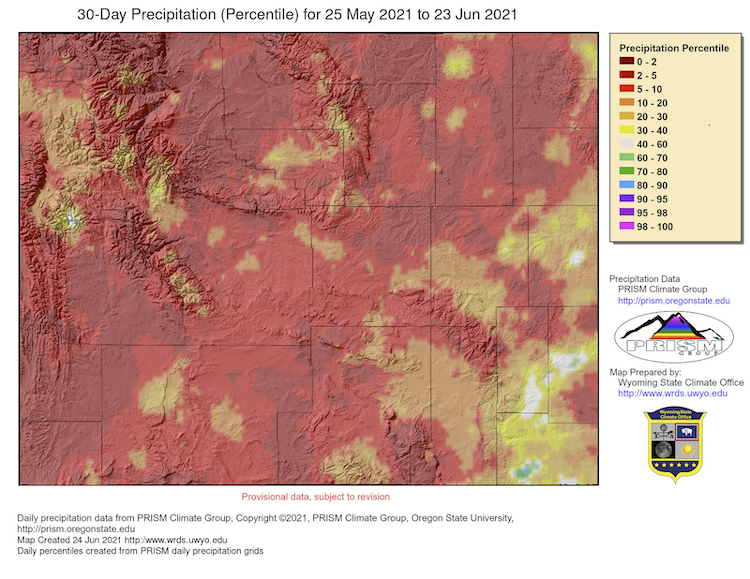
June Precipitation
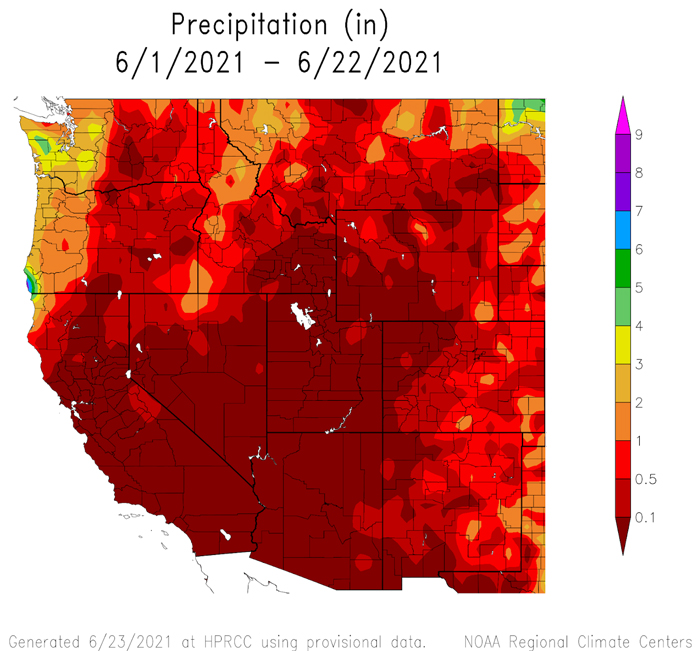
- June is typically the driest month of the year for Southwest states.
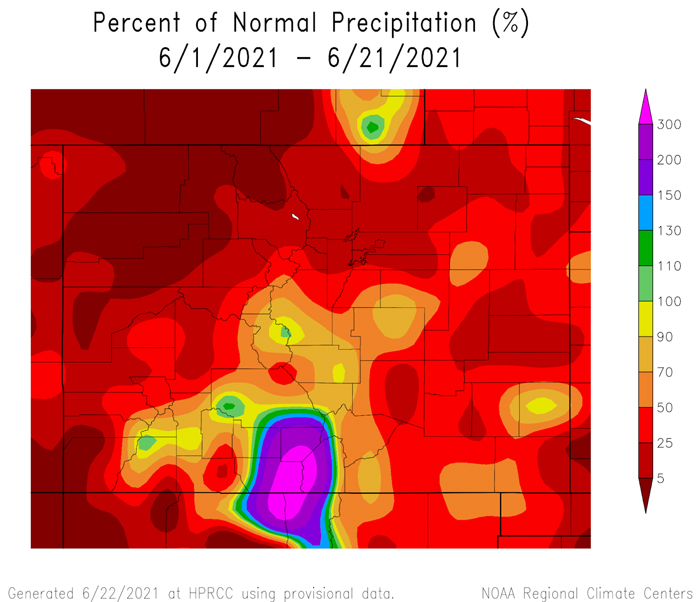
- Most of the precipitation in the region in June has been in southeast Colorado and northeast New Mexico.
- Most of Utah and Arizona have received 0.0 inches of precipitation for June, so far.
Precipitation Conditions: June 1-22, 2021
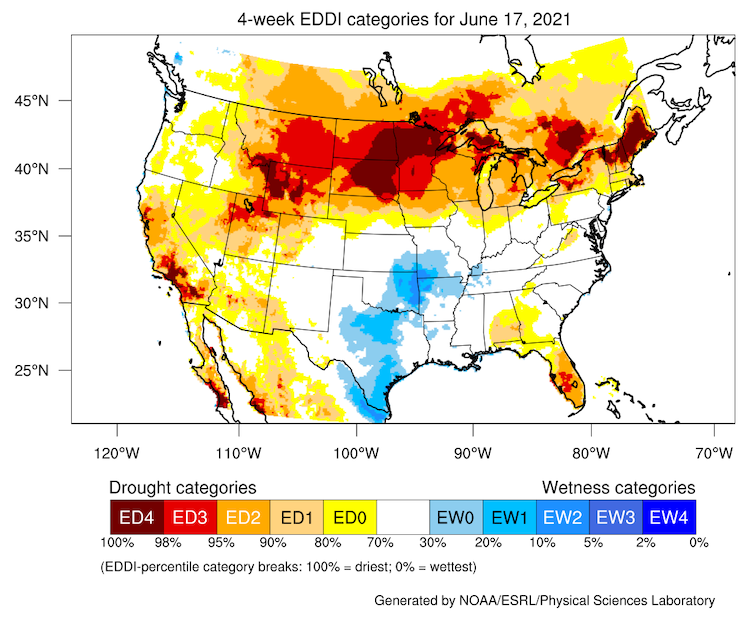
Evaporative Demand Drought Index (EDDI)
4-Week EDDI for June 17, 2021
- EDDI values have been near the long-term average for this time of year for eastern Colorado and New Mexico over the past month.
- There is high evaporative demand for this time of year for Arizona, western Colorado, and southern Utah.
- Very high EDDI values for northern Utah and Wyoming.
Forecasts and Seasonal Outlooks
Summer 2021 Heat and Wildfire
Heat:
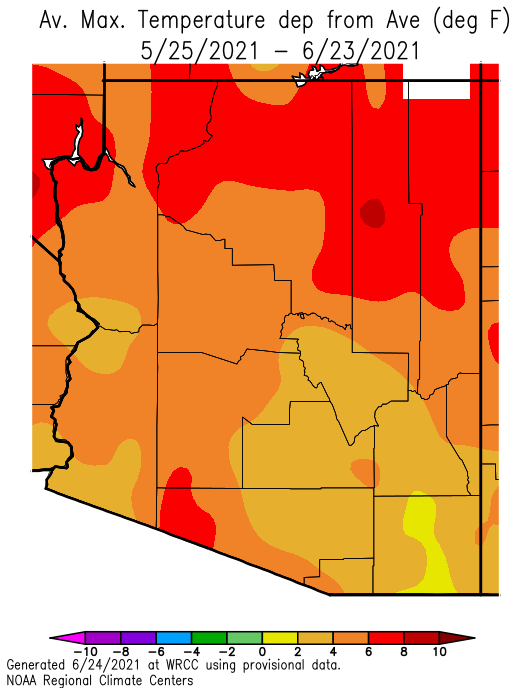
- The Intermountain West experienced a heatwave with extreme and record-setting temperatures in June.
- Learn more about the record-breaking heatwave impacting the West from Climate.gov.
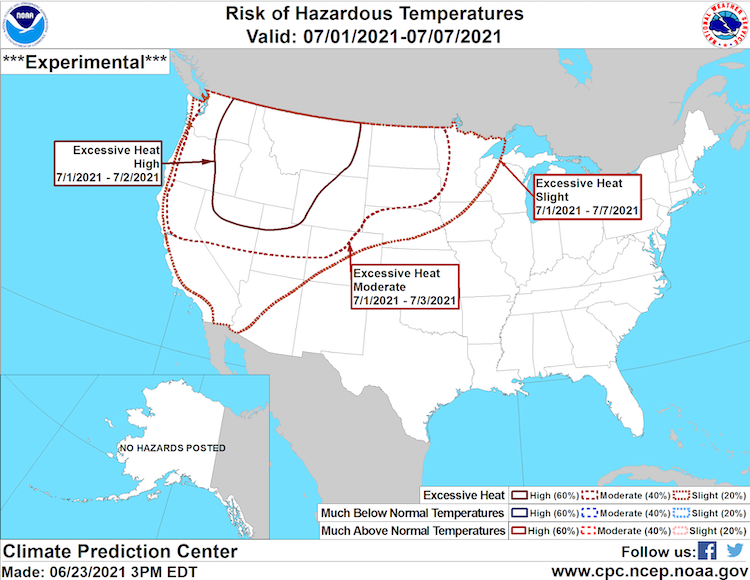
- The seasonal temperature outlook shows that above-normal temperatures are very likely this summer across the West.
- Excessive heat is forecast for the first week of July.
- Extreme heat will likely worsen drought conditions and wildfire risk.
8-14 Day Temperature Hazards Outlook
Fire:
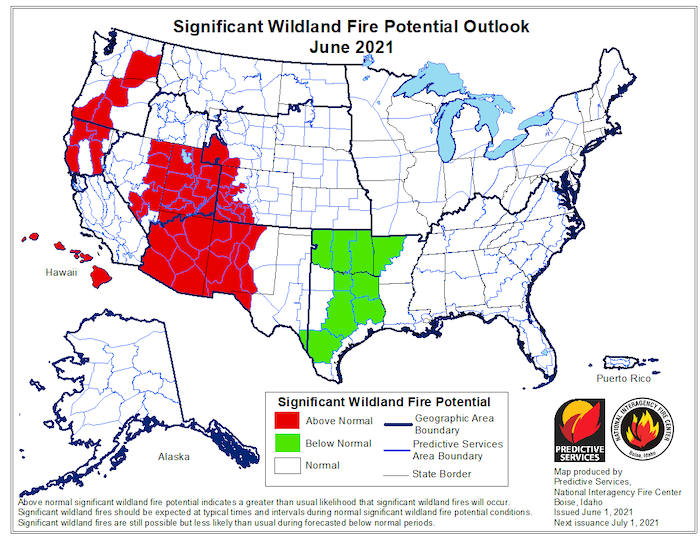
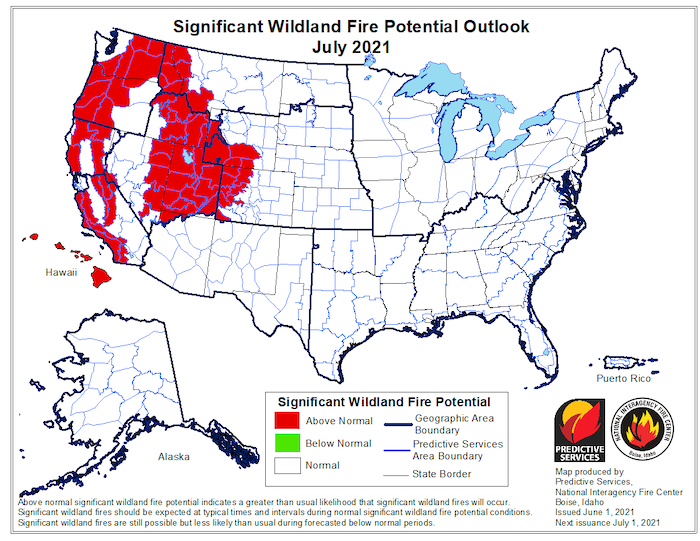
- Above-normal significant fire potential continues in the Southwest through June given the present widespread drought and heat.
- The National Interagency Fire Center (NIFC) has raised the National Preparedness Level to PL4.
- Since 1990, this is the second earliest PL4 has been reached.
Significant Wildland Fire Potential Outlooks: June and July 2021
8-14 Day Outlook
- There is a high chance that monsoonal precipitation will develop over the Southwest within the first week of July.
- The latest outlook shows increased odds of above-normal precipitation for Arizona, New Mexico, Southern Utah, and southern Nevada.
- Below-normal precipitation is likely in the 8-14 day outlook for Wyoming and eastern Colorado.
- Above-normal temperatures are most likely for northern Arizona, Utah, Wyoming, and northern Colorado, while odds slightly favor below-normal temperatures for eastern New Mexico.
8-14 Day Temperature Outlook
8-14 Day Precipitation Outlook
1-Month Outlook for July
- There is an equal chance of above or below normal precipitation for the Four-Corners States
- The month of July can see high precipitation totals over the southwest due to the monsoon onset.
- Below normal precipitation is the most likely outcome for Wyoming in July
- There is a high chance of above normal temperatures for the Intermountain West in July
July 2021 Temperature Outlook
July 2021 Precipitation Outlook
July-September Seasonal Outlook
- For July to September, there is a greater chance for above-normal temperatures across the Southwest.
- Below-normal precipitation is favored for the Intermountain West region through the summer. Arizona has an equal chance of above- or below-normal precipitation.
3-Month Temperature Outlook
3-Month Precipitation Outlook
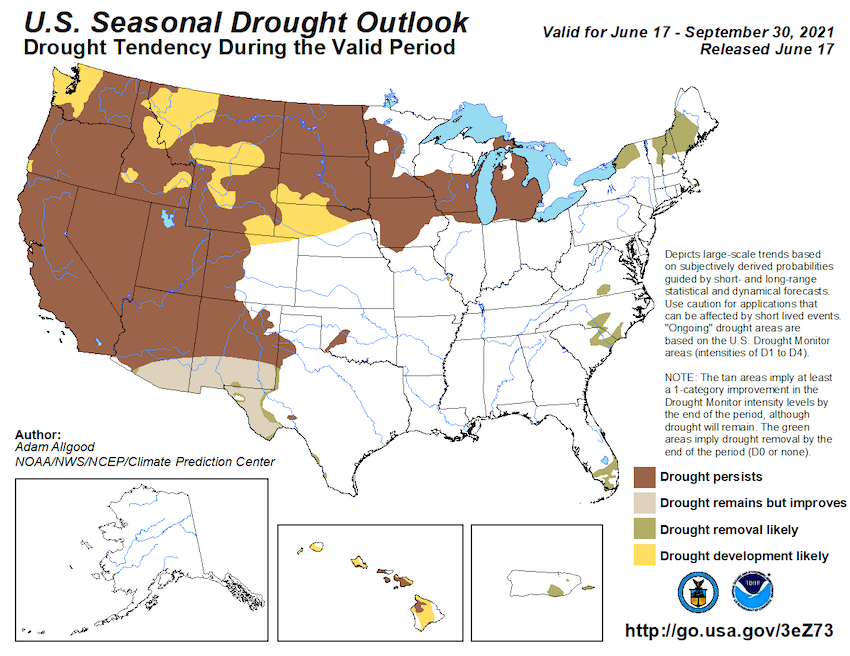
Drought Outlook
- Long-term drought conditions are forecast to continue at least through September across the Intermountain West.
- In anticipation of summer monsoonal precipitation, the drought outlook shows drought improving, but remaining, along the Mexican border.
3-Month Drought Outlook
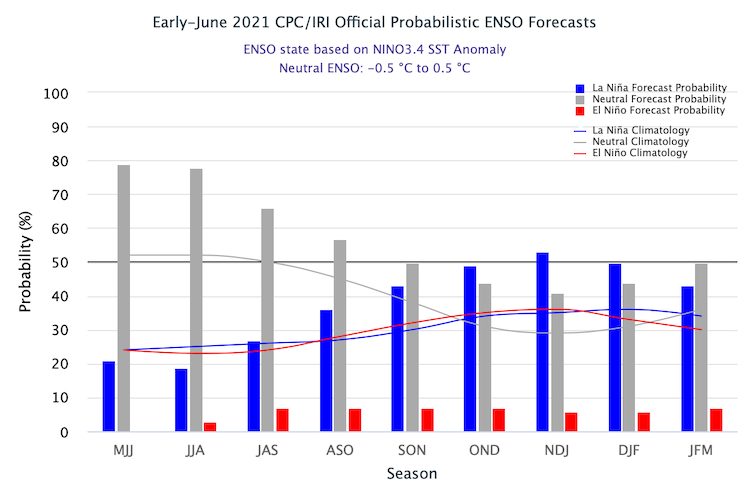
Climate Patterns
- NOAA’s El Niño–Southern Oscillation (ENSO) alert system status is currently at ENSO neutral.
- A return of La Niña is possible this winter. La Niña usually correlates with below normal winter precipitation in the Southwest U.S.
- For more information please check out the NOAA ENSO blog and the Western Regional Climate Center info page about the La Niña impacts for the west.
- ENSO forecasts from the International Research Institute (IRI) for Climate and Society show ENSO neutral conditions continuing through summer. A resurgence of La Niña conditions in autumn is possible.
Probability of El Niño, La Niña, or Neutral Conditions
State-Based Conditions and Impacts
Arizona
- 100% of Arizona is in some measure of drought, with 87% in extreme or exceptional drought.
- The Salt River reservoir system is 73% full, down from total system levels at 94% full last year.
- Majority of pasturelands across the state are at 50% below average or greater.
- Arizona had 21 wildland fires in June, with 345,776 acres burned.
- A record-breaking heatwave brought 6 consecutive days of 115°F or higher in Phoenix area.
- Lake Mead dropped to 1069.69 feet, which could trigger a Tier 1 shortage by the Central Arizona Project (CAP) in August (a Tier 1 shortage would reduce by 500,000 acre-feet).
Colorado
- There is a persistent and large gradient in drought conditions in Colorado. The east half of the state is mostly drought-free. The western slopes are in severe to exceptional drought according to the U.S. Drought Monitor.
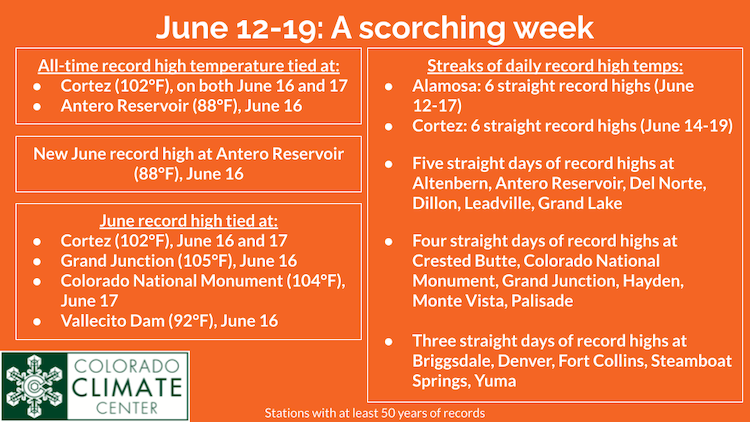
- Colorado has been much hotter and drier than normal since the start of June.
- Water supply for major municipalities is still in good shape following a wet spring.
- Cumulative runoff has been well below normal, particularly west of the Continental Divide. Blue Mesa Reservoir and McPhee Reservoir are holding record low storage.
- June has brought record heat to the western slopes. Cortez, Colorado tied its all-time record high of 102°F on both June 16 and 17. Cortez’ observation record extends back to the 1920s. Grand Junction and Monument tied all-time June high temperature records, 105°F and 104°F respectively.
New Mexico
- Recent rainfall over eastern New Mexico has improved but not removed drought conditions.
- Much of the state continues to struggle with long-term drought from the lack of summer precipitation from both 2019 and 2020. The 12-month period from April 2021 to May 2020 was the driest on record state-wide.
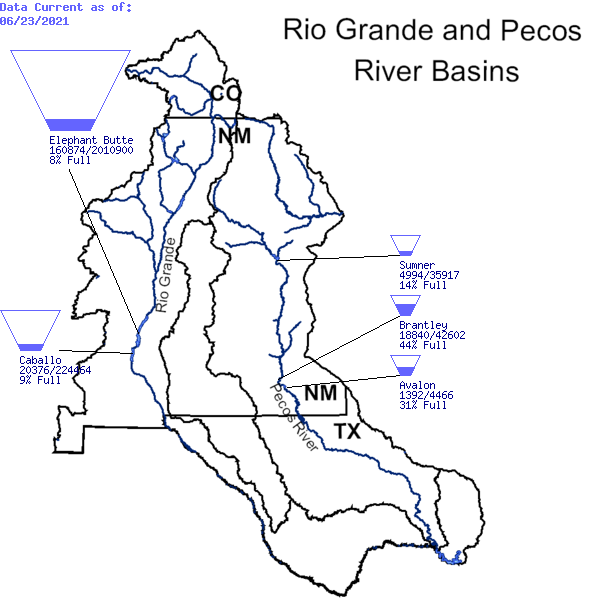
- Long-term drought shows up clearly in surface water levels in the Rio Grande and Pecos Basins. For example, Elephant Butte storage is 8% of capacity.
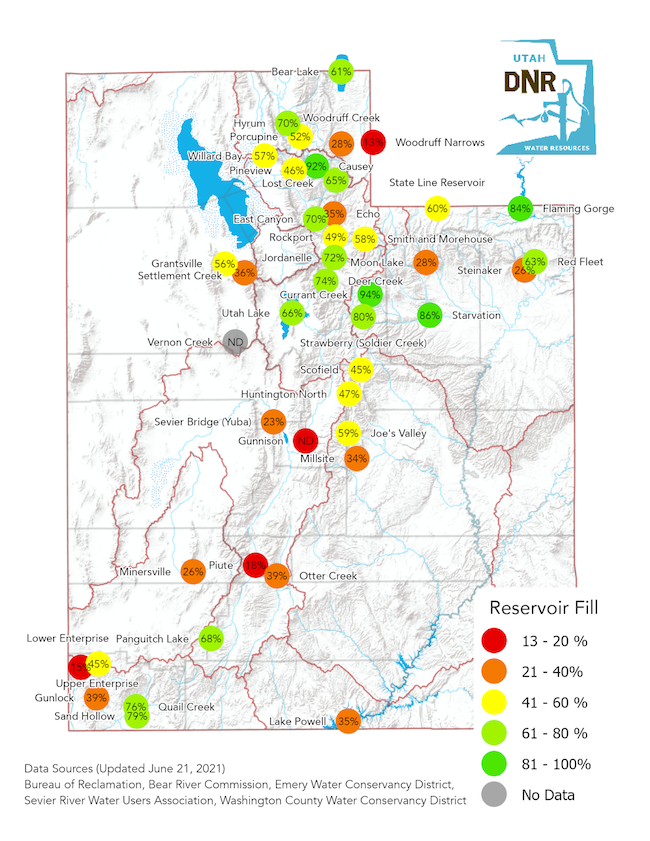
Utah
- June remains incredibly dry, with many areas not seeing any precipitation since mid-to-late May.
- The recent early June heat waves set numerous daily records, with many locations setting 5-6 daily records for the month so far, including Salt Lake City tying the hottest temperature ever recorded (107°F).
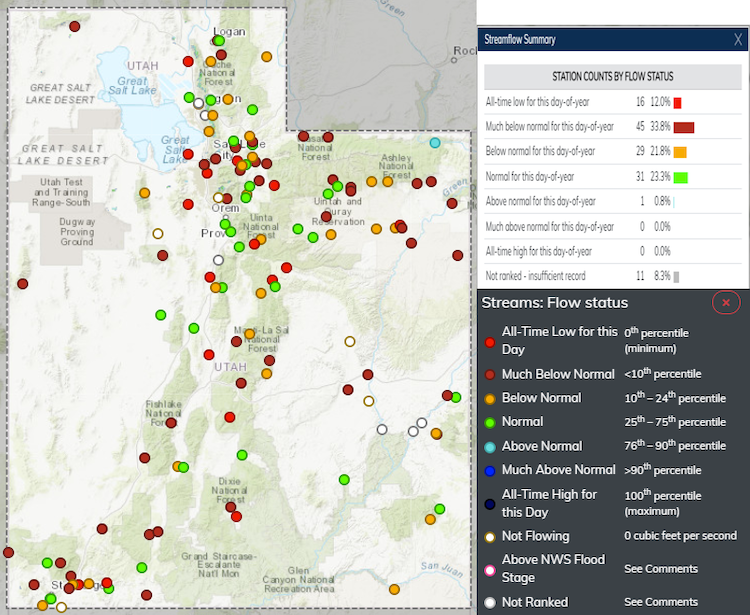
- Streamflow and reservoir levels reflect the poor spring runoff period, with 12% of gauged rivers flowing at all-time lows, 34% of rivers flowing below the 10th percentile, and another 22% of rivers flowing below the 25th percentile. Four rivers are currently reporting “no-flow.”
- Lake Powell currently stands at 34% of capacity, which is nearing the record low level.
- The Great Salt Lake level is only 6 inches away from its record low level, based on observations dating back to the mid 18th century.
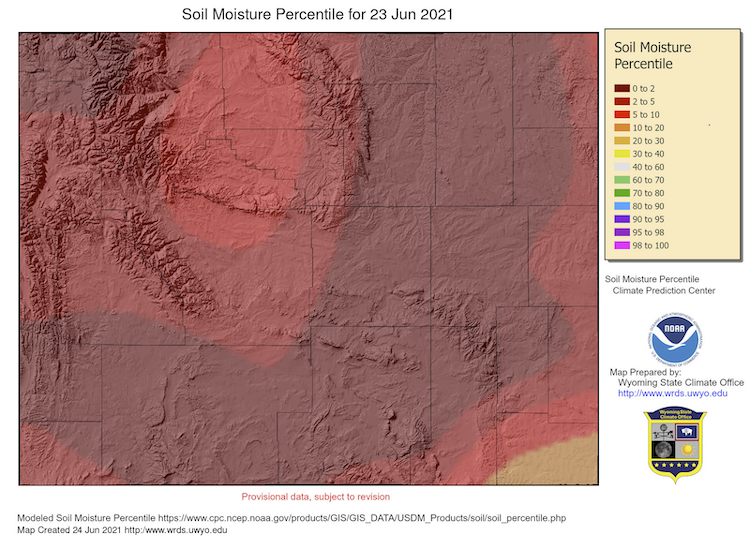
- Soil moisture observations from across the state show conditions at approximately the 10th percentile and trending lower over the month of June.
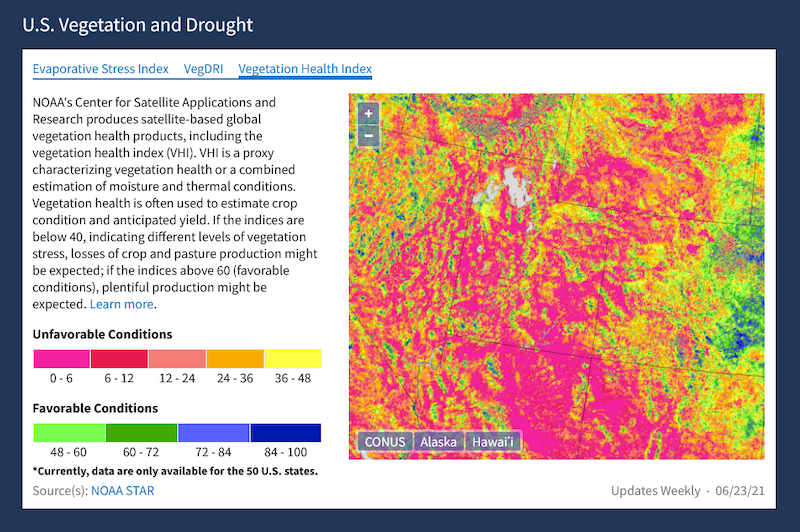
- Vegetative drought metrics show extreme stress to the state’s vegetation in response to the recent record heat waves, the lack of precipitation, and the depleted soil moisture.
- Utah’s drought severity has worsened as a result of June’s conditions, and expansion and degradation of drought categories are expected across Northern Utah and the final remaining D3 categories across eastern and central Utah, which are expected to see expanding D4 coverage going forward.
- Anecdotal reports from the agricultural community reflect the data indicating that the current drought is the worst seen by these communities in generations.
- Increasing water restrictions are occurring in urban population centers, and we expect this trend to continue through the summer.
Wyoming
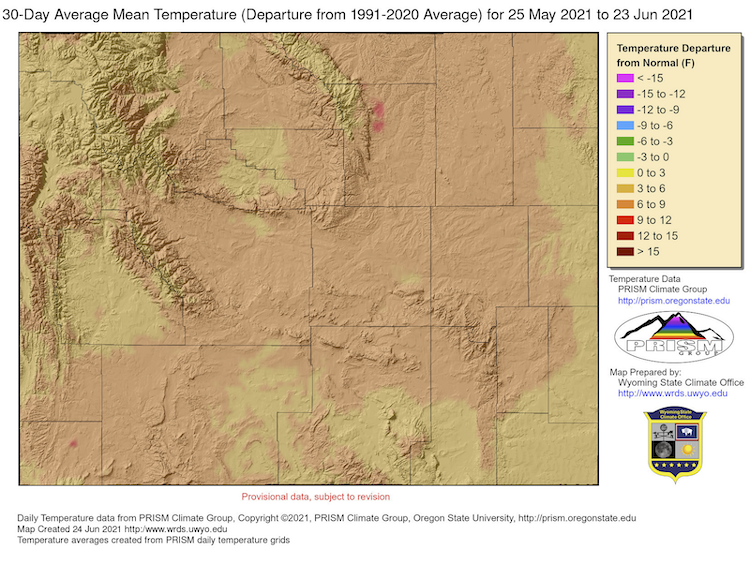
- June has been hot. The last 30 days have seen average mean temperatures for the entire state above the 1991-2020 average, with over three-quarters of the state at 6°F to 9°F above average.
- June has also been dry. Over the last 30 days only a few small pockets in the southeast are at or above median precipitation, and a majority of the state is under the 10th percentile in terms of precipitation received.
- These conditions have led to an expansion of drought–both an increase in area and degradation in categories–leaving only 2.4% of the state not in a drought category. About 9% of the state is in Extreme Drought (D3), now affecting 10 counties.
- Soil moisture continues to deteriorate. Except for the far southeast corner of the state where soil moisture is in the 10th to 20th percentile, the entire state is experiencing conditions at or below the 10th percentile, with more than half of the state at the 2nd or less percentile.
- Current maps, conditions, and resources for Wyoming are available at drought.wyo.gov.
For More Information
More local information is available from the following resources:
In Case You Missed It
- June 8, 2021, 10:00-10:45 a.m. (MDT): Intermountain West DEWS Climate, Water, and Drought Assessment Webinar
- June 21, 2021, 11:00-11:30 a.m. (MDT): Southwest Drought Briefing
Upcoming Events
- June 28, 2021, 11:00am–12:00pm (PDT): Pacific Northwest DEWS June Drought & Climate Outlook
Prepared By
Joel Lisonbee
NOAA/National Integrated Drought Information System (NIDIS)
Erin Saffell
Arizona State Climatologist/Arizona State University
Erin Boyle
Service Hydrologist, National Weather Service, Tucson, Arizona
Peter Goble
Colorado Climate Center/Colorado State University
Simon Wang and Jon Meyer
Utah Climate Center/Utah State University
Tony Bergantino
Water Resources Data System – Wyoming State Climate Office
This drought status update is issued in partnership between the National Oceanic and Atmospheric Administration (NOAA), and the offices of the state climatologist for Arizona, Colorado, New Mexico, Utah and Wyoming. The purpose of the update is to communicate a potential area of concern for drought expansion and/or development within the Intermountain West based on recent conditions and the upcoming forecast. NIDIS and its partners will issue future drought updates as conditions evolve.