Latest forecasts show drought continuing into summer.
Key Points
- Drought continues across the Intermountain West.
- Snowpack flatlined through January and February and is currently a little below average for most of the Intermountain West.
- A warm and dry spring is likely.
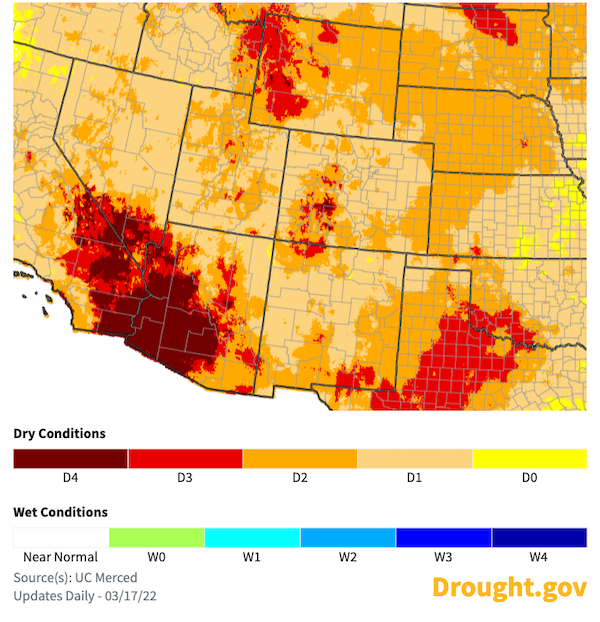
Current U.S. Drought Monitor map for the Intermountain West Drought Early Warning System (DEWS) region with data valid for March 15, 2022. The U.S. Drought Monitor is updated each Thursday to show the location and intensity of drought across the country.
18% of the Intermountain West DEWS region is experiencing extreme to exceptional drought (D3–D4).
U.S. Drought Monitor Categories
Current U.S. Drought Monitor map for the Intermountain West Drought Early Warning System (DEWS) region with data valid for March 15, 2022. The U.S. Drought Monitor is updated each Thursday to show the location and intensity of drought across the country.
18% of the Intermountain West DEWS region is experiencing extreme to exceptional drought (D3–D4).
Current Drought Conditions and Outlook
U.S. Drought Monitor Conditions
- There has been little change in drought conditions across the Intermountain West.
- Exceptional (D4) drought returned to the region in northeastern and southern New Mexico.
- 18% of the region is still experiencing extreme (D3) drought.
- Extreme (D3) drought conditions have been in place in this region since May 2020.
- Moderate (D1) or worse drought has been in the region since August 2009.
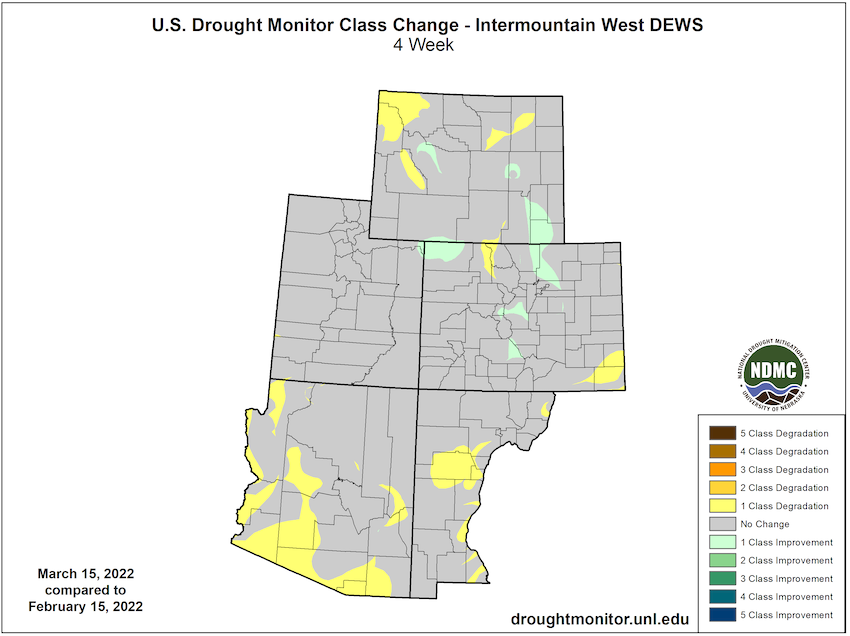
U.S. Drought Monitor 4-Week Change Map
Current Snow Water Equivalent (SWE)
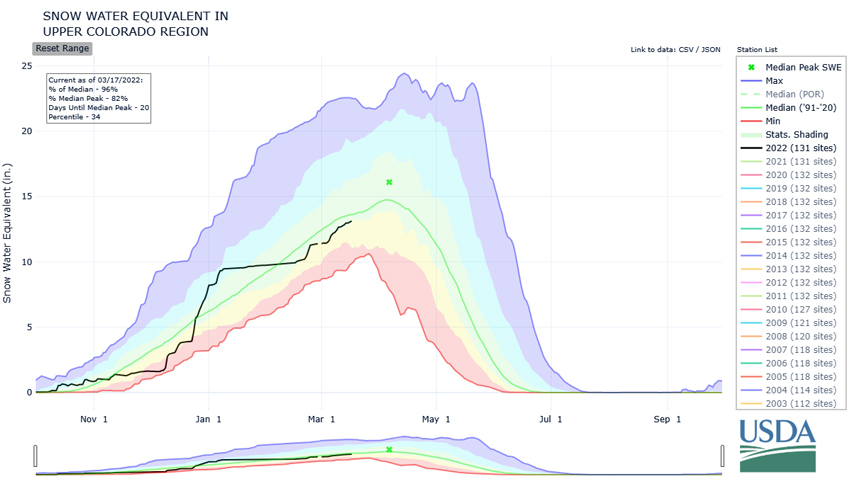
- Upper Colorado River SWE is currently at 97% of median for this time of year.
- Low precipitation totals in January and February were concerning. A few storms in late February and early March kept the snowpack accumulation near normal for this time of the season.
- Snowpack usually reaches its peak accumulation in early April. Upper Colorado River SWE is 82% of the historical average peak value.
Snow Water Equivalent: Upper Colorado
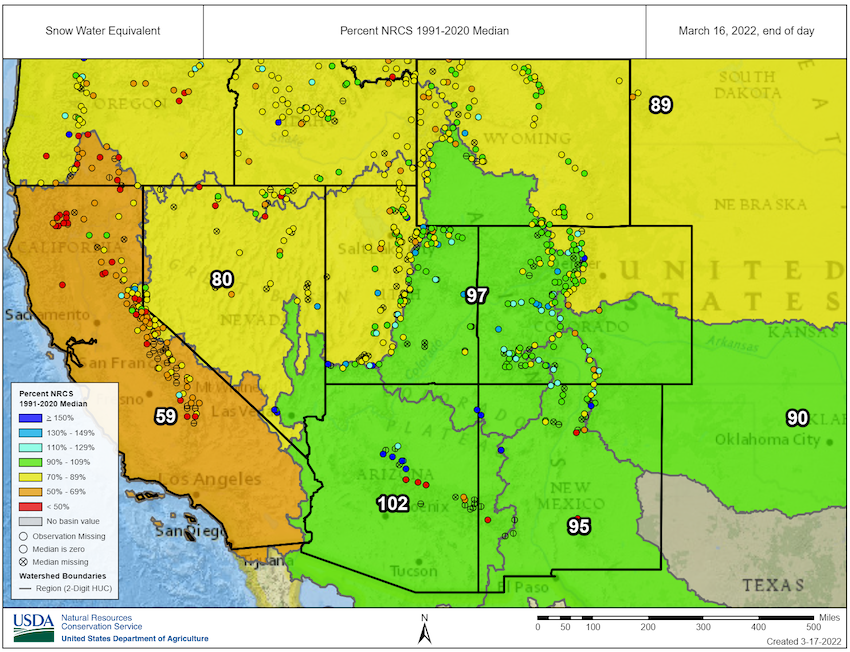
Snow Water Equivalent Percent of Median: March 16, 2022
Forecasts and Seasonal Outlooks
April 2022
- The Climate Prediction Center's monthly outlook for April shows an increased likelihood of above-normal temperatures and below-normal precipitation.
- The 4-week evaporative demand forecast shows increased Evaporative Demand Drought Index (EDDI) across the whole Intermountain West, with especially high evaporative demand for southern Arizona.
April 2022 Temperature Outlook
April 2022 Precipitation Outlook
Evaporative Demand Drought Index (EDDI) 4-Week Forecast
3-Month Outlook for April–June 2022
Seasonal forecasts show a hot and dry spring ahead for the Intermountain West:
- Lower-than-normal precipitation is more likely than not for Utah, Colorado, Wyoming, and New Mexico.
- There are equal chances of wet or dry April–June period for southern Arizona. Note that these are usually the driest months of the year for Arizona.
- Odds strongly favor increased temperatures through spring and early summer 2022 for the Intermountain West.
Three-Month Temperature Outlook: April–June 2022
Three-Month Precipitation Outlook: April–June 2022
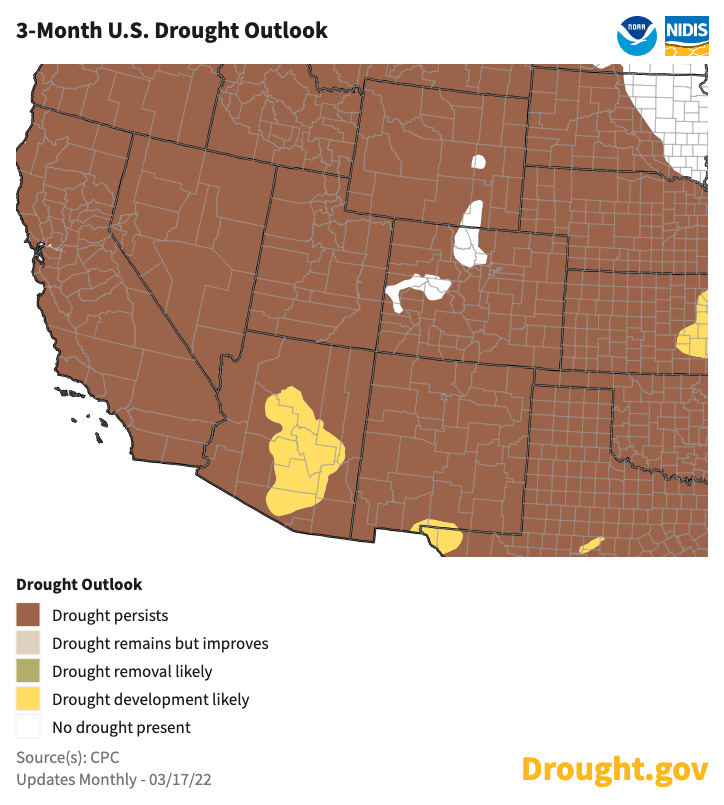
Seasonal Drought Outlook
The Climate Prediction Center's 3-month drought outlook shows that drought is expected to continue for the Intermountain West through spring.
U.S. Drought Outlook: March 17–June 30, 2022
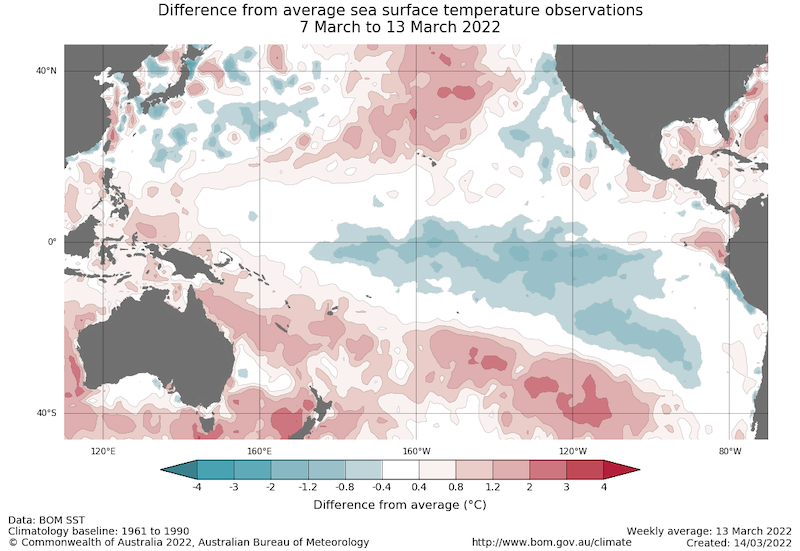
La Niña to Continue Through Spring and Possibly into Summer
- One of the primary drivers of drought across the Southwest this season was a La Niña pattern in the Pacific.
- February saw a small resurgence in cool sea surface temperatures in the central equatorial Pacific (the primary indication of a La Niña pattern). It is likely that La Niña conditions will persist into early summer.
- Spring precipitation is usually lower than normal in the Southwest.
- For more information, please check out the NOAA El Niño–Southern Oscillation (ENSO) blog.
Sea Surface Temperature Anomalies (°C) for March 10–16, 2022
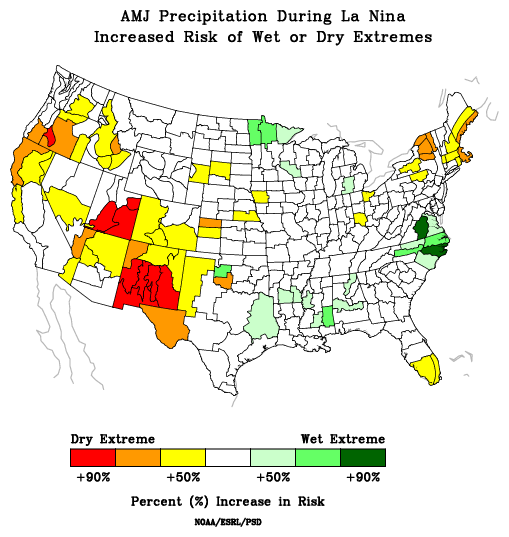
Risk of Wet/Dry Extremes in April–June During La Niña
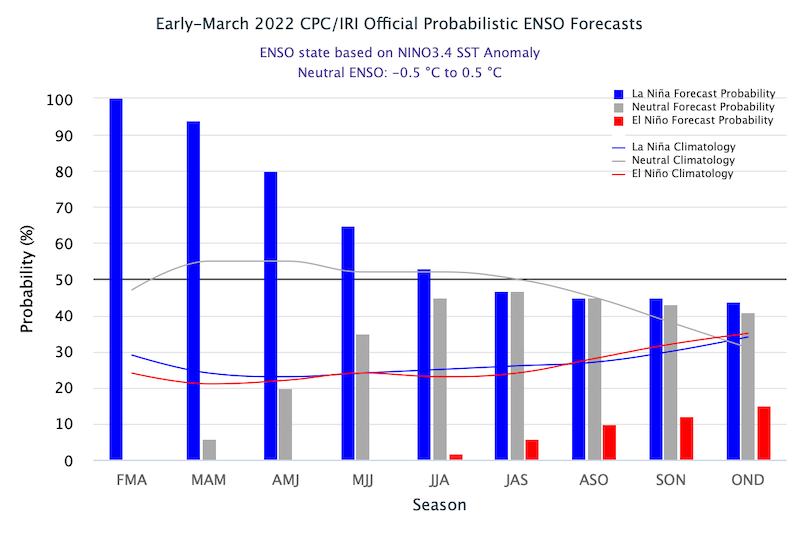
Probability of El Niño, La Niña, or Neutral Conditions
State-Based Conditions and Impacts
Arizona
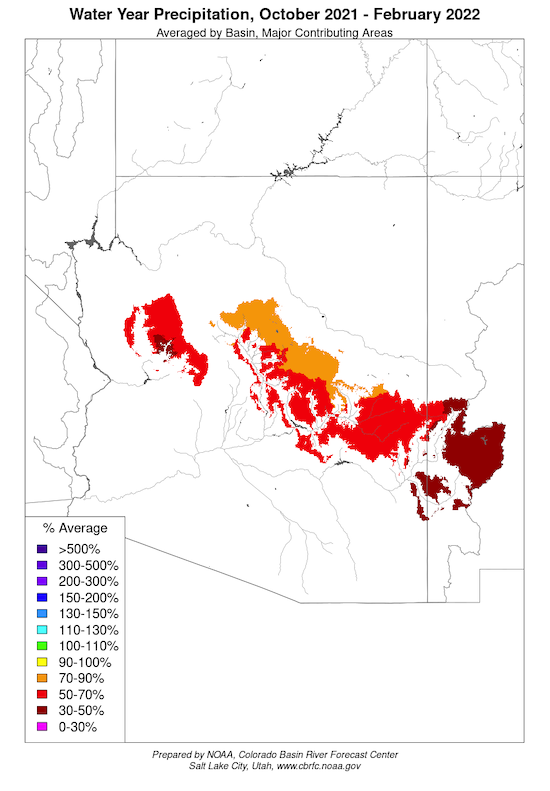
- Short-term drought increased slightly in February. Moderate (D1) drought increased by 15%, largely in central Arizona, and extreme (D3) drought newly appeared along western Arizona.
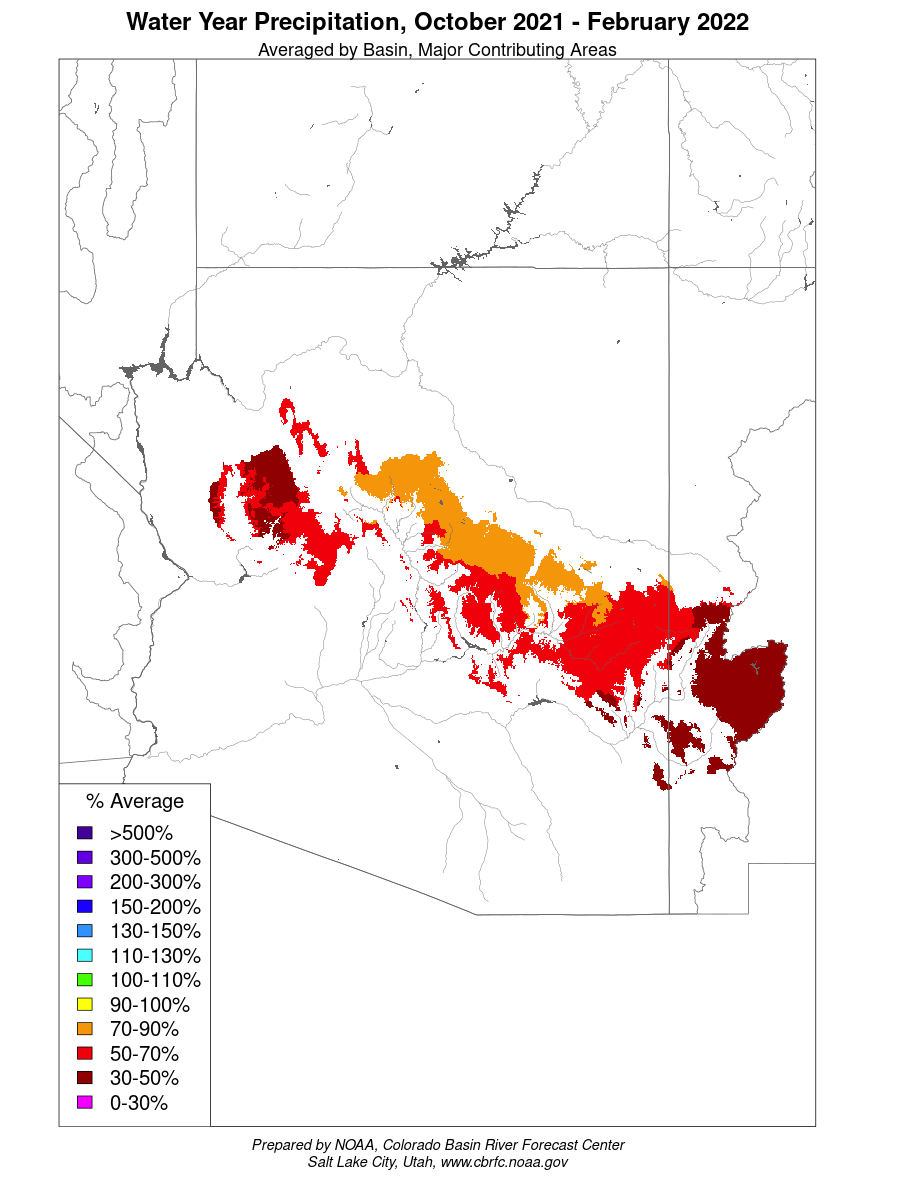
- Precipitation was below normal for much of the state, with a total statewide precipitation of 0.41 inches for February (0.74 inches below normal). Northeastern Arizona, while still entrenched in long-term extreme (D3) drought, received near-normal precipitation for the month.
- Western portions of the Mogollon Rim were close to 150% of median snow water equivalent by the end of February. Eastern portions of the Mogollon Rim to the White Mountains were below 100% of median snow water equivalent, with some less than 50% of median.
Water Year 2022 Precipitation, Averaged by Basin
Colorado
- February was a colder than normal month across the state of Colorado, keeping drought impacts mostly frozen.
- Precipitation was above normal on the northern Front Range and Urban Corridor, leading to marginal drought improvements in north-central Colorado.
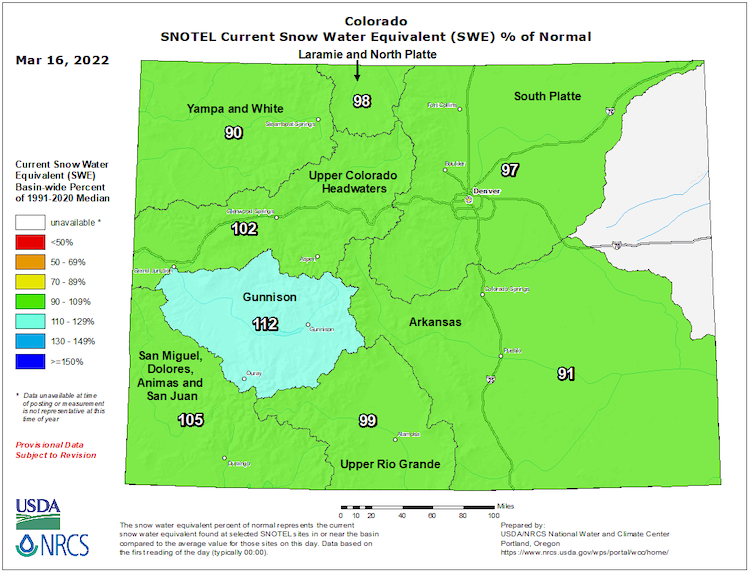
- Snowfall was below normal west of the Continental Divide in February, and previously high snowpack values have regressed towards the mean. Major Colorado River Basins are storing between 90%–112% of normal snowpack at over 80% of the way into the snow season.
- Normal runoff is not expected for two reasons: low soil moisture/groundwater, and an increased probability of below-normal precipitation and above-normal temperatures in spring. The Colorado Basin River Forecast Center is forecasting 65%–80% of normal runoff this April–July.
- Soil moisture remains low on the eastern plains. Winter wheat stands were impacted by dry soils in the fall, and windstorms in December. Farmers are waiting to see how things look at greenup, but due to colder than normal temperatures, greenup will likely be later than normal.
Colorado Basin-Wide Snow Water Equivalent
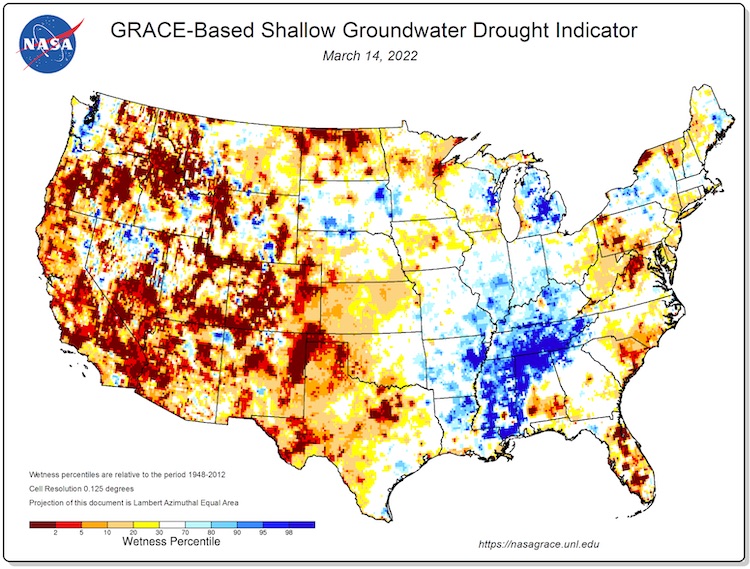
Shallow Groundwater Drought Indicator
New Mexico
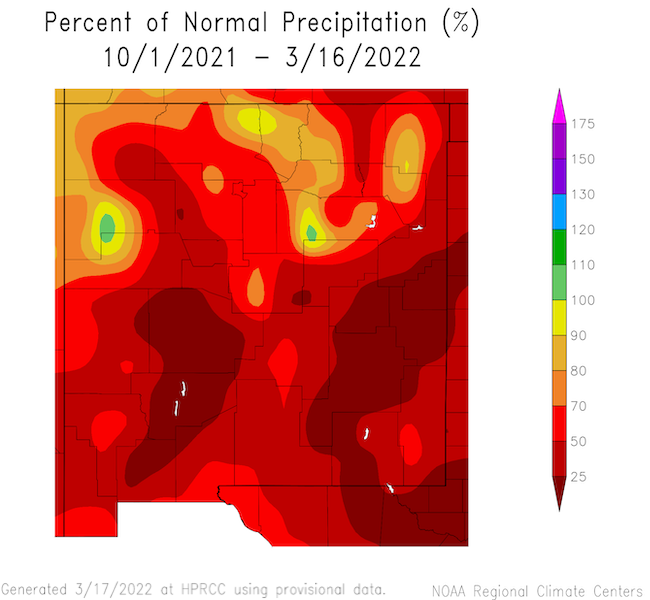
- December through February was exceptionally dry for New Mexico and was the second winter in a row with a statewide average of less than 1.5 inches of precipitation for the season.
- Reservoir storage:
- Elephant Butte is at 11% of capacity.
- Caballo is at 7% of capacity.
- Eastern New Mexico has been in an extremely dry pattern since July.
Water Year 2022 Percent of Normal Precipitation
Utah
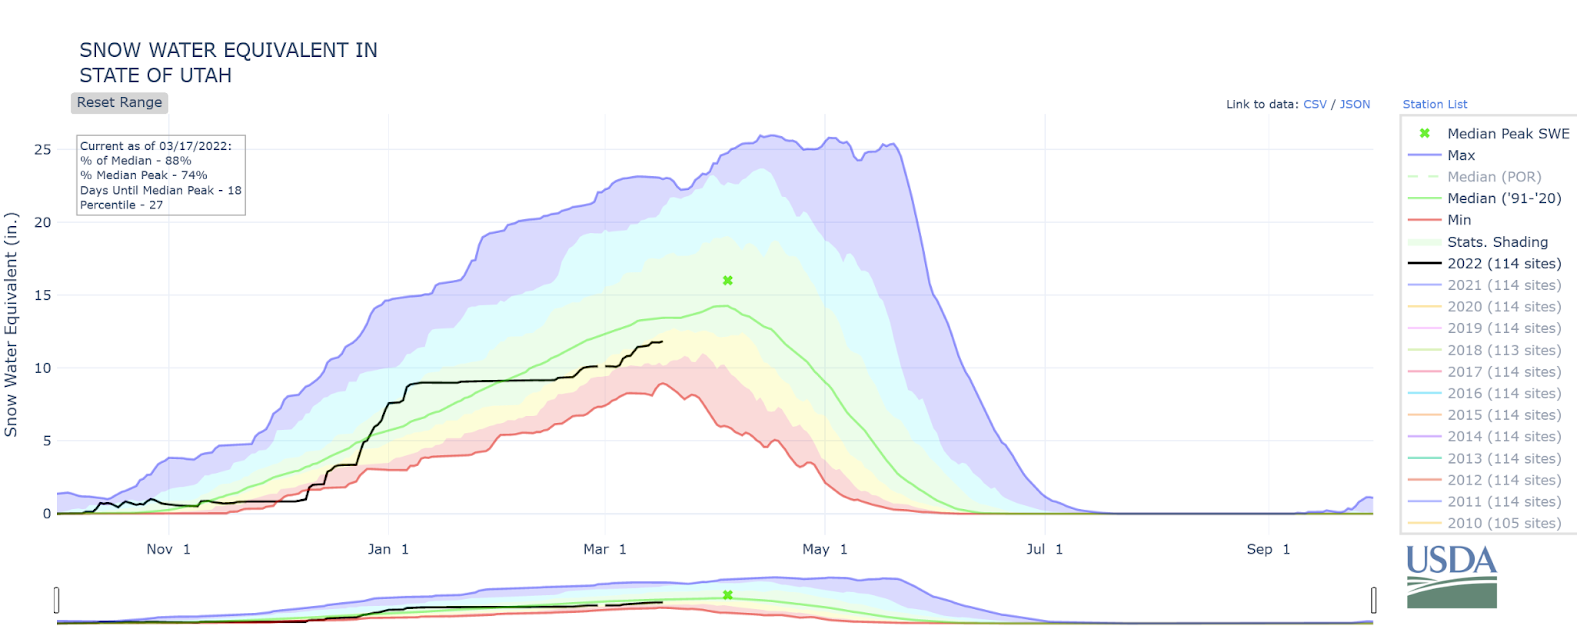
- Lackluster January and February snowfall has trended the state’s snowpack back below normal, which currently sits at 88% of median (i.e., normal) statewide despite recent storm activity.
- Cool February temperatures limited snowpack loss, while soil moisture remains above average but has trended drier in recent months.
- March streamflow forecasts have declined 15%–25% since February 1 forecasts.
Utah Statewide Snow Water Equivalent (Inches)
April–July Streamflow Volume Forecasts
Wyoming
- Soil moisture continues to be low (10th percentile or less) for parts of the northeast, especially eastern Sheridan, northeastern Johnson, northern Campbell, and northwestern Crook counties.
- Precipitation:
- Precipitation has been average for the southeast and central parts of Wyoming, as well as some of the lower elevations in the northwest.
- The northeast, far northwest, and south central areas have missed out on much of the January snows.
- Temperatures:
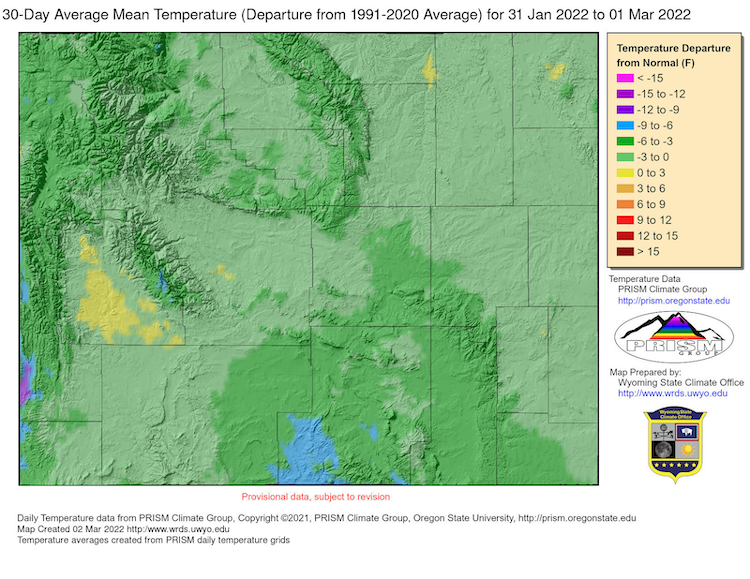
- Bitter cold the last week of February brought average mean temperatures for the month to below average for all but parts of Sublette County and scattered pockets in the northeast.
Average Mean Temperatures: January 31–March 1
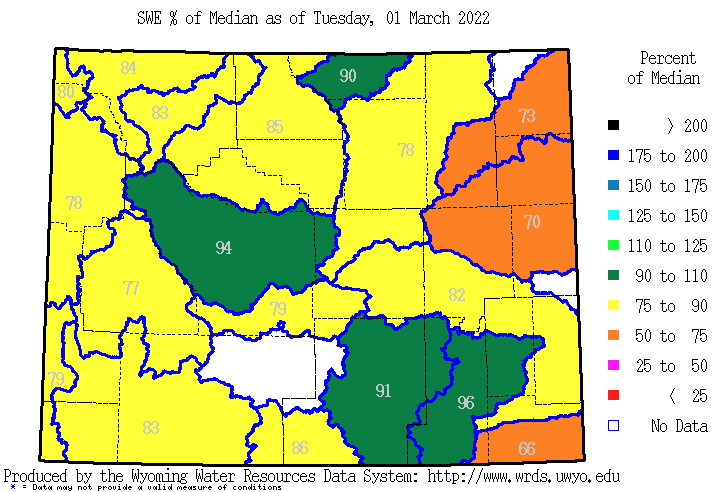
- Precipitation statewide was mostly below average except parts of the Bighorn Basin and a few other isolated areas. The western part of the state, along with the Medicine Bows and Sierra Madre ranges, had the lowest percentages of normal with amounts totaling less than half of normal.
- Soil moisture continues to be a concern in the northern parts of the state where drought has continued to linger.
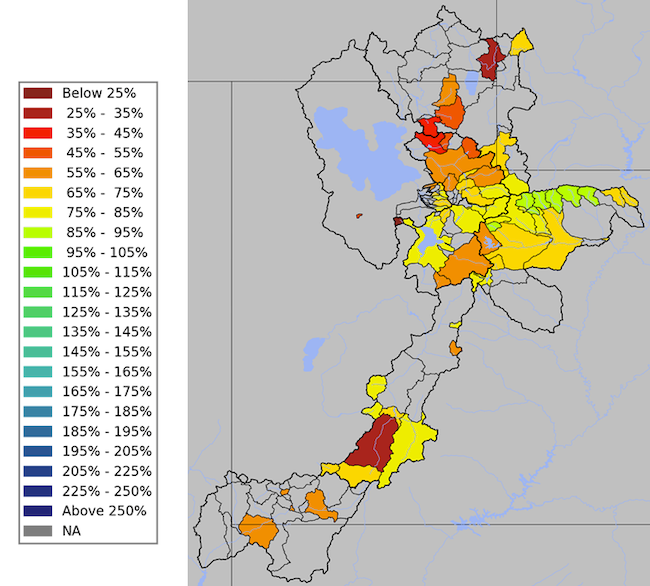
- Snowpack at the end of February was below 90 percent of median in all but four of Wyoming’s basins.
Wyoming Basin-Wide Snow Water Equivalent
For More Information
More local information is available from the following resources:
- Your state climatologist
- Your local National Weather Service office
- Western Water Assessment: Intermountain West Climate Dashboard
In Case You Missed It
- February 1, 2022: Environmental Flows in the Rio Grande – Rio Bravo Basin
- February 22, 2022: Soil Moisture 101: What It Means and How It’s Measured
- February 23, 2022: Southwest Drought Briefing
Upcoming Events
- March 18, 2022, 2 p.m. MT: Southwest Drought Learning Network Quarterly Meeting
- March 28, 2022, 11 a.m. PT: California-Nevada Drought & Climate Outlook Webinar
- March 29, 2022, 2 p.m. ET: Soil Moisture Webinar Series — Practical Applications of Soil Moisture Information
- March 29, 2022: Spring Runoff Conference, Utah State University
- April 5, 2022, 1 p.m. MT: Southwest Drought Briefing: A Focus on Snowpack
Prepared By
Joel Lisonbee
NOAA/National Integrated Drought Information System (NIDIS)
Erin Saffell
Arizona State Climatologist/Arizona State University
Peter Goble
Colorado Climate Center/Colorado State University
Jon Meyer
Utah Climate Center/Utah State University
Tony Bergantino
Water Resources Data System – Wyoming State Climate Office
This drought status update is issued in partnership between the National Oceanic and Atmospheric Administration (NOAA), and the offices of the state climatologist for Arizona, Colorado, New Mexico, Utah and Wyoming. The purpose of the update is to communicate a potential area of concern for drought expansion and/or development within the Intermountain West based on recent conditions and the upcoming forecast. NIDIS and its partners will issue future drought status updates as conditions evolve.
