Western snow drought remains as storms continue to track to the Pacific Northwest and Northern Rockies.
Key Points:
- Snow drought has expanded and/or intensified across the Sierra Nevada, Arizona, New Mexico, Utah, and southwest Colorado.
- While conditions improved in Washington and across northern Idaho and Montana, warm snow drought has developed in central and northern Oregon.
This USDA Natural Resources Conservation Service (NRCS) map shows Snow Telemetry (SNOTEL) snow water equivalent (SWE) basin values over the western U.S. as a percent of the NRCS 1981–2010 median. Only stations with at least 20 years of data are included in the station averages.
The SWE percent of normal represents the current snow water equivalent found at selected SNOTEL sites in or near the basin compared to the average value for those sites on this day. This map is valid as of January 10, 2021.
For an interactive version of this map please visit NRCS.
This USDA Natural Resources Conservation Service (NRCS) map shows Snow Telemetry (SNOTEL) snow water equivalent (SWE) basin values throughout Alaska as a percent of the NRCS 1981–2010 median. Only stations with at least 20 years of data are included in the station averages.
The SWE percent of normal represents the current snow water equivalent found at selected SNOTEL sites in or near the basin compared to the average value for those sites on this day. This map is valid as of January 10, 2021.
For an interactive version of this map please visit NRCS.
SWE Percent of NRCS 1981-2010 Median
This USDA Natural Resources Conservation Service (NRCS) map shows Snow Telemetry (SNOTEL) snow water equivalent (SWE) basin values over the western U.S. as a percent of the NRCS 1981–2010 median. Only stations with at least 20 years of data are included in the station averages.
The SWE percent of normal represents the current snow water equivalent found at selected SNOTEL sites in or near the basin compared to the average value for those sites on this day. This map is valid as of January 10, 2021.
For an interactive version of this map please visit NRCS.
This USDA Natural Resources Conservation Service (NRCS) map shows Snow Telemetry (SNOTEL) snow water equivalent (SWE) basin values throughout Alaska as a percent of the NRCS 1981–2010 median. Only stations with at least 20 years of data are included in the station averages.
The SWE percent of normal represents the current snow water equivalent found at selected SNOTEL sites in or near the basin compared to the average value for those sites on this day. This map is valid as of January 10, 2021.
For an interactive version of this map please visit NRCS.
Current Conditions
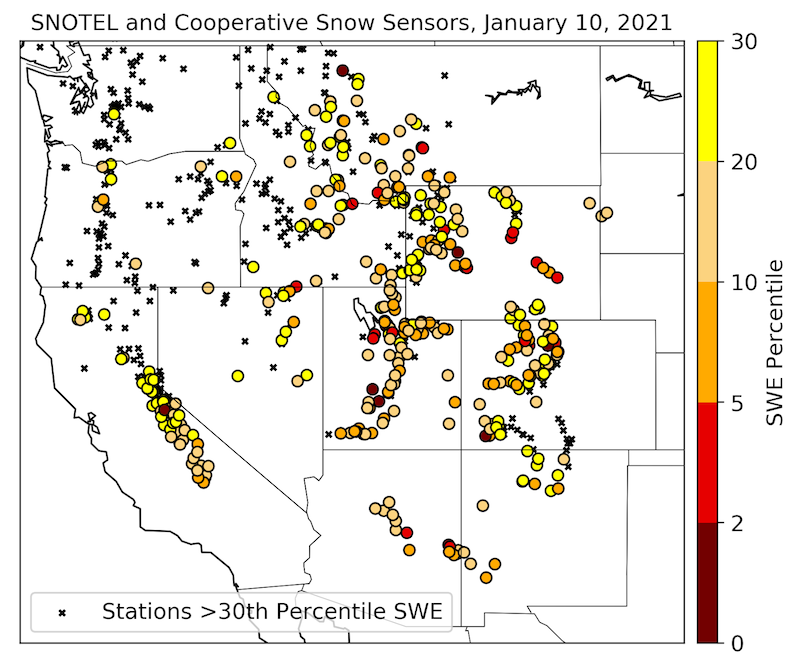
Since mid-December, little has changed in the spatial patterns of snow drought across the Western U.S. The storm track has remained active in the Pacific Northwest into the Northern Rockies with little moisture and snowfall in the mountains of the Southwest and Four Corners states. Currently, 79% of SNOTEL and Cooperative Snow Sensor stations in the West are reporting snow water equivalent (SWE) below the median (at least 20 years of data) with 52% below the 30th percentile. Snow drought has expanded and/or intensified across the Sierra Nevada, Arizona, New Mexico, Utah, and southwest Colorado. For example, all stations in Arizona and most in New Mexico with >20 years of record are below the 30th percentile. Conditions have improved in northern Idaho and northwest Montana from storms in late December and again in early January that brought heavy mountain snow and increases in SWE to above the snow drought threshold (30th percentile) and in some cases above median. Several lower elevation stations in the Cascades of central and northern Oregon are now reporting snow drought conditions due to warm storms, high snow levels, and lack of SWE accumulation. The higher elevation stations in this region are reporting near-to-above normal SWE.
Snowpack in most areas of Alaska, including the Kenai Peninsula and the mountains to the northeast of Fairbanks, is near or above average. However there are stations reporting SWE at or below median. Coldfoot, located on the south slope of the Brooks Range, is currently at the 12th percentile SWE with records going back to 1995. Higher terrain in the southern Panhandle appears to have limited snowpack (based on webcam images), but liquid precipitation has been excessive.
* Quantifying snow drought values is an ongoing research effort. Here we have used the 30th percentile as a starting point based on partner expertise. Get more information on the current definition of snow drought here.
For more information, please contact:
Daniel McEvoy
Western Regional Climate Center
Amanda Sheffield
NOAA NIDIS California-Nevada Regional Drought Information Coordinator
Britt Parker
NOAA NIDIS Pacific Northwest and Missouri River Basin Regional Drought Information Coordinator
NIDIS and its partners launched this snow drought effort in 2018 to provide data, maps, and tools for monitoring snow drought and its impacts as well as communicating the status of snow drought across the United States, including Alaska. Thank you to our partners for your continued support of this effort and review of these updates. If you would like to report snow drought impacts, please use the link below. Information collected will be shared with the states affected to help us better understand the short term, long term, and cumulative impacts of snow drought to the citizens and the economy of the regions reliant on snowpack.
Report your Snow Drought Impacts Data and Maps | Snow Drought Research and Learn | Snow Drought