Snow Drought Persists in Most of the West With Record Dryness in the Southwest
Key Points
- The previous month saw extremely dry conditions across most of the West, leading to snow deficits in more basins and the development of snow drought.
- Exceptional snow drought persists in the Southwest (Arizona, Colorado, Nevada, New Mexico, Utah) as a result of record dry conditions.
- Lower elevation snow drought developed across Alaska due to record-breaking temperatures and precipitation falling as rain instead of snow.
- A recent storm cycle brought welcome moisture back to the Pacific Northwest, but deficits still remain in the region.
- La Niña conditions are present and expected to persist from February–April 2025 (59% chance). A La Niña pattern generally favors wetter conditions in the Northwest and drier conditions in the Southwest, and normal to above-average temperatures.
Snow Telemetry (SNOTEL) snow water equivalent (SWE) values for watersheds in the western U.S. as a percentage of the 1991–2020 median recorded by the USDA Natural Resources Conservation Service (NRCS). Only stations with at least 20 years of data are included in the station averages.
The SWE percent of median, in this figure and in the text, represents the current SWE at selected SNOTEL stations in or near the basin compared to the median value for those stations on the same date from 1991–2020. This map is valid through the end of the day February 2, 2025.
For an interactive version of this map, please visit NRCS.
Snow Telemetry (SNOTEL) and snow course snow water equivalent (SWE) values for watersheds in Alaska as a percentage of the 1991–2020 median recorded by the USDA Natural Resources Conservation Service (NRCS). Only stations with at least 20 years of data are included in the station averages.
The SWE percentage of median, in this figure and in the text, represents the current SWE at selected SNOTEL stations in or near the basin compared to the median value for those stations on the same date. This map is valid through the end of the day February 2, 2025.
For an interactive version of this map, please visit NRCS.
Drought is defined as the lack of precipitation over an extended period of time, usually for a season or more, that results in a water shortage. Changes in precipitation can substantially disrupt crops and livestock, influence the frequency and intensity of severe weather events, and affect the quality and quantity of water available for municipal and industrial use.
Learn MoreSnow drought is a period of abnormally low snowpack for the time of year. Snowpack typically acts as a natural reservoir, providing water throughout the drier summer months. Lack of snowpack storage, or a shift in timing of snowmelt, can be a challenge for drought planning.
Learn MorePeriods of drought can lead to inadequate water supply, threatening the health, safety, and welfare of communities. Streamflow, groundwater, reservoir, and snowpack data are key to monitoring and forecasting water supply.
Learn MoreIn a drought, lower water levels or snowpack can affect the availability of recreational activities and associated tourism, and a resulting loss of revenue can severely impact supply chains and the economy. Drought—as well as negative perceptions of drought, fire bans, or wildfires—may also result in decreased visitations, cancellations in hotel stays, a reduction in booked holidays, or reduced merchandise sales.
Learn MoreDrought is defined as the lack of precipitation over an extended period of time, usually for a season or more, that results in a water shortage. Changes in precipitation can substantially disrupt crops and livestock, influence the frequency and intensity of severe weather events, and affect the quality and quantity of water available for municipal and industrial use.
Learn MoreSnow drought is a period of abnormally low snowpack for the time of year. Snowpack typically acts as a natural reservoir, providing water throughout the drier summer months. Lack of snowpack storage, or a shift in timing of snowmelt, can be a challenge for drought planning.
Learn MorePeriods of drought can lead to inadequate water supply, threatening the health, safety, and welfare of communities. Streamflow, groundwater, reservoir, and snowpack data are key to monitoring and forecasting water supply.
Learn MoreIn a drought, lower water levels or snowpack can affect the availability of recreational activities and associated tourism, and a resulting loss of revenue can severely impact supply chains and the economy. Drought—as well as negative perceptions of drought, fire bans, or wildfires—may also result in decreased visitations, cancellations in hotel stays, a reduction in booked holidays, or reduced merchandise sales.
Learn MorePercent of Median Snow Water Equivalent
< 50% of Median
Current snow water equivalent (SWE) is less than 50% of the median SWE value for this day of the year, compared to historical conditions from 1991–2020.
50%–70% of Median
Current snow water equivalent (SWE) is between 50%–70% of the median SWE value for this day of the year, compared to historical conditions from 1991–2020.
70%–90% of Median
Current snow water equivalent (SWE) is between 70%–90% of the median SWE value for this day of the year, compared to historical conditions from 1991–2020.
90%–110% of Median
Current snow water equivalent (SWE) is between 90%–110% of the median SWE value for this day of the year, compared to historical conditions from 1991–2020.
110%–130% of Median
Current snow water equivalent (SWE) is between 110%–130% of the median SWE value for this day of the year, compared to historical conditions from 1991–2020.
130%–150% of Median
Current snow water equivalent (SWE) is between 130%–150% of the median SWE value for this day of the year, compared to historical conditions from 1991–2020.
>150% of Median
Current snow water equivalent (SWE) is greater than 150% of the median SWE value for this day of the year, compared to historical conditions from 1991–2020.
Percent of Median Snow Water Equivalent
< 50% of Median
Current snow water equivalent (SWE) is less than 50% of the median SWE value for this day of the year, compared to historical conditions from 1991–2020.
50%–70% of Median
Current snow water equivalent (SWE) is between 50%–70% of the median SWE value for this day of the year, compared to historical conditions from 1991–2020.
70%–90% of Median
Current snow water equivalent (SWE) is between 70%–90% of the median SWE value for this day of the year, compared to historical conditions from 1991–2020.
90%–110% of Median
Current snow water equivalent (SWE) is between 90%–110% of the median SWE value for this day of the year, compared to historical conditions from 1991–2020.
110%–130% of Median
Current snow water equivalent (SWE) is between 110%–130% of the median SWE value for this day of the year, compared to historical conditions from 1991–2020.
130%–150% of Median
Current snow water equivalent (SWE) is between 130%–150% of the median SWE value for this day of the year, compared to historical conditions from 1991–2020.
>150% of Median
Current snow water equivalent (SWE) is greater than 150% of the median SWE value for this day of the year, compared to historical conditions from 1991–2020.
Snow Telemetry (SNOTEL) snow water equivalent (SWE) values for watersheds in the western U.S. as a percentage of the 1991–2020 median recorded by the USDA Natural Resources Conservation Service (NRCS). Only stations with at least 20 years of data are included in the station averages.
The SWE percent of median, in this figure and in the text, represents the current SWE at selected SNOTEL stations in or near the basin compared to the median value for those stations on the same date from 1991–2020. This map is valid through the end of the day February 2, 2025.
For an interactive version of this map, please visit NRCS.
Snow Telemetry (SNOTEL) and snow course snow water equivalent (SWE) values for watersheds in Alaska as a percentage of the 1991–2020 median recorded by the USDA Natural Resources Conservation Service (NRCS). Only stations with at least 20 years of data are included in the station averages.
The SWE percentage of median, in this figure and in the text, represents the current SWE at selected SNOTEL stations in or near the basin compared to the median value for those stations on the same date. This map is valid through the end of the day February 2, 2025.
For an interactive version of this map, please visit NRCS.
View an updated, interactive version of this map from the USDA's Natural Resources Conservation Service. You can also view SWE data on Drought.gov.
View an updated, interactive version of this map from the USDA's Natural Resources Conservation Service. You can also view SWE data on Drought.gov.
Drought is defined as the lack of precipitation over an extended period of time, usually for a season or more, that results in a water shortage. Changes in precipitation can substantially disrupt crops and livestock, influence the frequency and intensity of severe weather events, and affect the quality and quantity of water available for municipal and industrial use.
Learn MoreSnow drought is a period of abnormally low snowpack for the time of year. Snowpack typically acts as a natural reservoir, providing water throughout the drier summer months. Lack of snowpack storage, or a shift in timing of snowmelt, can be a challenge for drought planning.
Learn MorePeriods of drought can lead to inadequate water supply, threatening the health, safety, and welfare of communities. Streamflow, groundwater, reservoir, and snowpack data are key to monitoring and forecasting water supply.
Learn MoreIn a drought, lower water levels or snowpack can affect the availability of recreational activities and associated tourism, and a resulting loss of revenue can severely impact supply chains and the economy. Drought—as well as negative perceptions of drought, fire bans, or wildfires—may also result in decreased visitations, cancellations in hotel stays, a reduction in booked holidays, or reduced merchandise sales.
Learn MoreDrought is defined as the lack of precipitation over an extended period of time, usually for a season or more, that results in a water shortage. Changes in precipitation can substantially disrupt crops and livestock, influence the frequency and intensity of severe weather events, and affect the quality and quantity of water available for municipal and industrial use.
Learn MoreSnow drought is a period of abnormally low snowpack for the time of year. Snowpack typically acts as a natural reservoir, providing water throughout the drier summer months. Lack of snowpack storage, or a shift in timing of snowmelt, can be a challenge for drought planning.
Learn MorePeriods of drought can lead to inadequate water supply, threatening the health, safety, and welfare of communities. Streamflow, groundwater, reservoir, and snowpack data are key to monitoring and forecasting water supply.
Learn MoreIn a drought, lower water levels or snowpack can affect the availability of recreational activities and associated tourism, and a resulting loss of revenue can severely impact supply chains and the economy. Drought—as well as negative perceptions of drought, fire bans, or wildfires—may also result in decreased visitations, cancellations in hotel stays, a reduction in booked holidays, or reduced merchandise sales.
Learn MoreSnow Drought Conditions Summary
This update is based on data available as of Monday, February 3, 2025 at 12:00 a.m. PT. We acknowledge that conditions are evolving.
Current Conditions
Exceptionally dry conditions in much of the West in January were caused by a stationary high pressure system in the northeastern Pacific Ocean, preventing weather fronts from passing through. The worst snow drought conditions persist throughout Arizona, New Mexico, the southern Sierra Nevada, southwestern Utah, and parts of southwestern Colorado, where little precipitation has fallen in the past two months.
Limited precipitation caused snow drought to develop throughout northern Washington, and in some locations of northern Idaho and northwestern Montana. Recent winter storms from January 31–February 3 impacted the northern and central tiers of the West. These storms may improve snow drought conditions in western Wyoming, southwestern Montana, southern Idaho, and the northern Sierra Nevada.
Looking Ahead
With La Niña conditions present and expected to persist through February–April 2025 (59% chance), the seasonal (February–April) outlook follows a La Niña pattern, favoring normal to above-normal precipitation in the northwestern United States, and drier conditions in the Southwest (except northern Utah and Nevada). The 3-4 week outlooks suggest persistent and potentially worsening snow drought conditions in the southwestern states (southern California, Nevada, and Utah and most of Arizona and New Mexico), resulting from equal chances to above-normal probability of higher temperatures and equal chances to below-normal probability for precipitation.
Jump to conditions for your region:
- Colorado, Idaho, Montana, Utah, Wyoming (Rocky Mountains) Snow Conditions
- New Mexico and Arizona Snow Conditions
- Oregon and Washington Snow Conditions
- California and Nevada Snow Conditions
- Alaska Snow Conditions
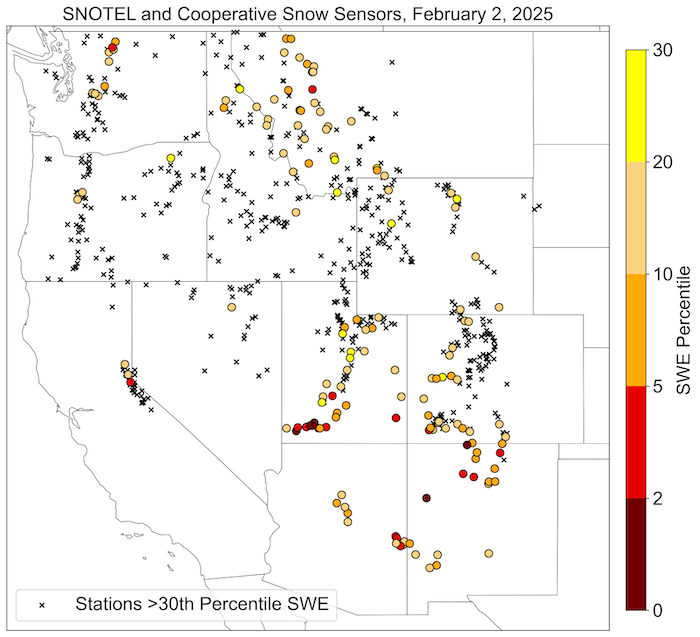
Stations with SWE Below the 30th Percentile in the Western U.S.
Key Takeaway: The Southwest faces severe snow drought conditions with some SNOTEL stations reporting record low snow water equivalent (SWE).
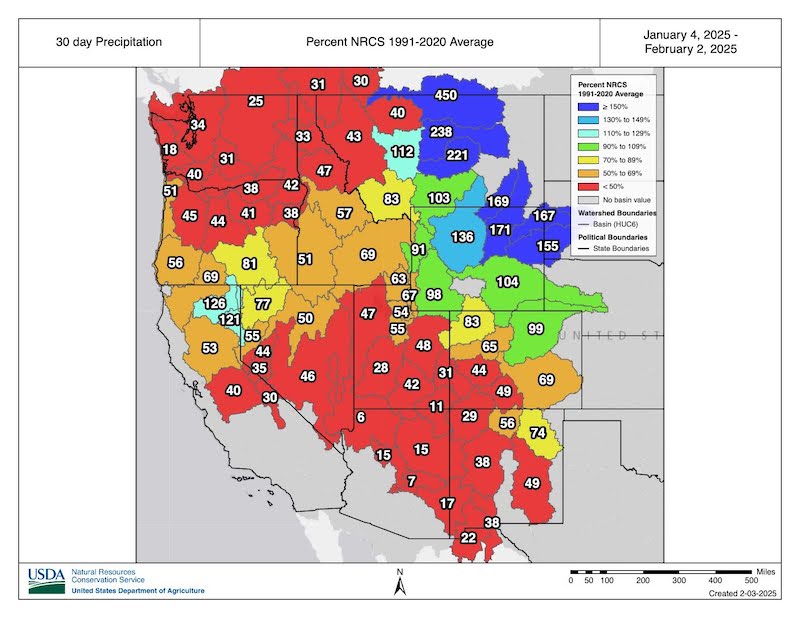
30-Day Precipitation as a Percentage of Average Across Basins in the Western U.S.
Key Takeaway: Basins from the Pacific Northwest to the Southwest saw exceptionally dry conditions in the past 30 days. Precipitation was between 0% and 50% of average.
Rocky Mountain Snow Conditions (Colorado, Idaho, Montana, Utah, Wyoming)
Northern Rockies
Snow drought conditions persisted over the past month for much of the Northern Rocky Mountains. Many SNOTEL stations, particularly in western Montana, are reporting snow water equivalent (SWE) below the 20th percentile.
The Marias Basin, on the east side of the Rocky Mountains in northwestern Montana, is currently reporting 59% of normal SWE and is showing the worst conditions in the region. SWE in northwestern Wyoming and southwestern Montana is still below normal, but improvements have occurred as a result of storms over the past several days. The Upper Yellowstone Basin is currently at 87% of normal SWE, and the Upper Missouri Basin is currently at 88% of normal SWE. Other basins in the region are generally at 80–100% of normal SWE, with much higher variability at the SNOTEL station level.
Central Rockies
Snowpack in Utah is generally below normal, with extreme snow drought conditions in the southern part of the state. Record high temperatures eliminated low and mid-elevation snowpack statewide.
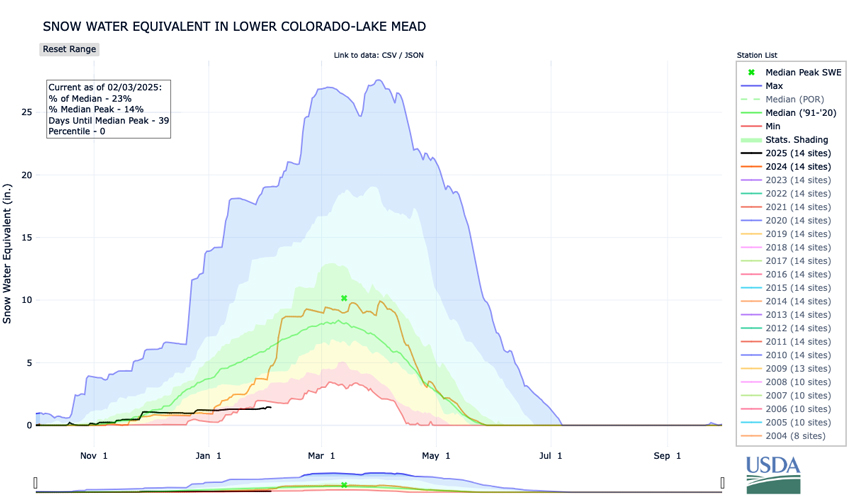
Central and northern Utah SNOTEL stations across Hydrologic Unit Code (HUC) 6 basins range from 71–85% of normal snow water equivalent (SWE). Across southern basins, SWE values are at 13–59% of normal. Multiple stations in the Lower Colorado-Lake Mead HUC 6 Basin in southwestern Utah (Gardner Peak, Webster Flat, and Castle Valley) are reporting record low SWE, with mean SWE across the basin sitting at 23% of median, the lowest in the period of record dating to 1987.
SNOTEL stations in far southwestern Utah received less than one inch of precipitation in the past 30 days, with some stations receiving no precipitation. These areas also report record low soil moisture levels, heightening concern for low runoff volumes. Storms that improved snowpack further north have not extended far enough south to give this region substantial amounts of snow.
Portions of the Rocky Mountains on the west slope in Colorado and the San Juan and Sangre De Cristo Mountains in southwestern Colorado are experiencing snow drought conditions. SNOTEL stations in the northwest portion of the Gunnison Basin are much below the basin mean at 84% of normal, with several stations below the 20th percentile. It was a very dry month for the Upper San Juan and Rio Grande Headwaters, which fell to 6058% and 720% of normal SWE, respectively.
Snow Water Equivalent in Lower Colorado-Lake Mead Basin
Key Takeaway: Snow drought conditions are exceptional across the Southwest due to significantly below-normal precipitation, which reduced snow water equivalent (SWE) levels to record low levels in the Lower Colorado-Lake Mead Basin.
Arizona and New Mexico Snow Conditions
Snow drought conditions persist in Arizona and New Mexico with nearly all SNOTEL stations reporting less than 20th percentile snow water equivalent (SWE). The region saw very little precipitation over the past 30 days, with SNOTEL stations generally reporting 10–30% of normal, mirroring the record dry years of 2000 and 2006.
In Arizona, the Verde Basin is at 10% of normal SWE, the Little Colorado Basin is at 17% of normal, and the Salt Basin is at 6% of normal.
Conditions are slightly better in New Mexico with the Upper Rio Grande Basin at 44% of normal SWE, Rio Grande-Elephant Butte Basin at 24% of normal, and Upper Canadian Basin at 53% of normal. However, when broken down to the sub-basin level, 7 out of the 15 sub-basins within New Mexico are below 25% of normal.
As of February 3, 6 out of 29 New Mexico SNOTEL stations were at historically low values, with record-breaking high temperatures reported across the state. This warming pattern is expected to persist for several days, which will lead to further evaporation and runoff of the little snowpack that remains in New Mexico. Looking forward, an active pattern is forecast for much of the West; however, Arizona and New Mexico are likely to remain dry.
Oregon and Washington Snow Conditions
Much of Oregon and Washington received significantly below-normal precipitation in January, with extreme dryness prevalent over most of the Washington Cascade Range and Olympic Mountains.
Three SNOTEL stations in the Olympic Mountains and eight SNOTEL stations in the northern Washington Cascade Range recorded the lowest January precipitation since records began in 1981, driving below-normal snow water equivalent (SWE) and snow drought conditions. The Puget Sound Basin is currently reporting the lowest SWE in the region at 76% of normal, and the Upper Columbia Basin is currently at 80% of normal. SWE at the SNOTEL station level is somewhat variable, but most stations from about Stampede Pass northward are reporting below-normal SWE, with some stations below the 20th percentile. Snow conditions are closer to normal in the southern Washington Cascade Range.
In the northern Oregon Cascade Range, snowpack is near normal at the HUC 6 basin level, with more variability at the station level. Below-normal SWE is present at many lower-elevation stations across the state. SWE in the Willamette and Deschutes Basins is currently at 100% and 117% of normal, respectively. Snowpack conditions further south in the Cascade Range are generally well above normal. Most SNOTEL stations in the Blue Mountains in northeastern Oregon are also reporting well-above-normal SWE.
California and Nevada Snow Conditions
January was exceptionally dry in California and Nevada, with much of the region receiving less than 25% of normal precipitation. Snowpack in most of the Sierra Nevada and the mountains of southern Nevada have fallen to below normal.
California Department of Water Resources (DWR) snow pillows are reporting 101%, 64%, and 46% of normal snow water equivalent (SWE) for the northern, central, and southern regions of California, respectively. On the east side of the Sierra Nevada, SNOTEL stations are reporting 65%, 64%, and 60% of normal SWE for the Truckee, Carson, and Walker Basins, respectively.
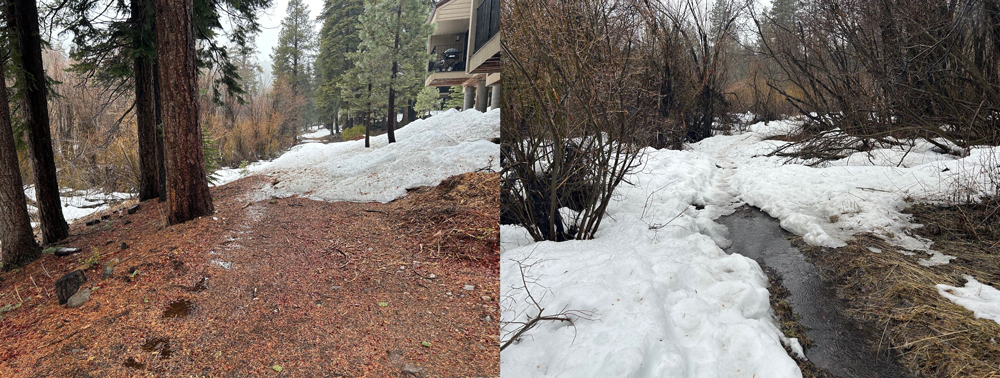
Starting January 31, a 3-day storm brought copious amounts of precipitation to the northern Sierra Nevada but it was accompanied by warmer-than-normal temperatures leading to snow accumulation at elevations greater than 9,000 feet.
Some SWE was added to the snowpack at higher elevations (generally 1–3 inches), but SWE declined at locations below 7,000 feet due to prolonged heavy rainfall. For example, in the Lake Tahoe Basin, the Tahoe City Cross station lost 2.4 inches of SWE, and the Fallen Leaf Lake station lost 1.7 inches, leaving patchy to no snow at lake level (see figure below). According to SWE measurements at SNOTEL and DWR stations, the current Sierra Nevada snowpack is similar to the snowpack at the same time last year.
Very little snow has fallen in the Spring Mountains in southern Nevada, with SNOTEL stations reporting 0%, 3% and 4% of normal SWE at Rainbow Canyon, Bristlecone Trail, and Lee Canyon, respectively. This is the lowest snowpack for Bristlecone Trail and Lee Canyon since records began in 2009.
Alaska Snow Conditions
January was exceptionally wet in Southcentral Alaska, with many of the SNOTEL stations reporting record-high monthly precipitation totals. Coastal mountains in the region received 15–30 or more inches of precipitation. Above-normal temperatures in January led to a changing gradient, based on elevation, for percent normal snow water equivalent (SWE) with higher elevational sites receiving snow and lower sites rain.
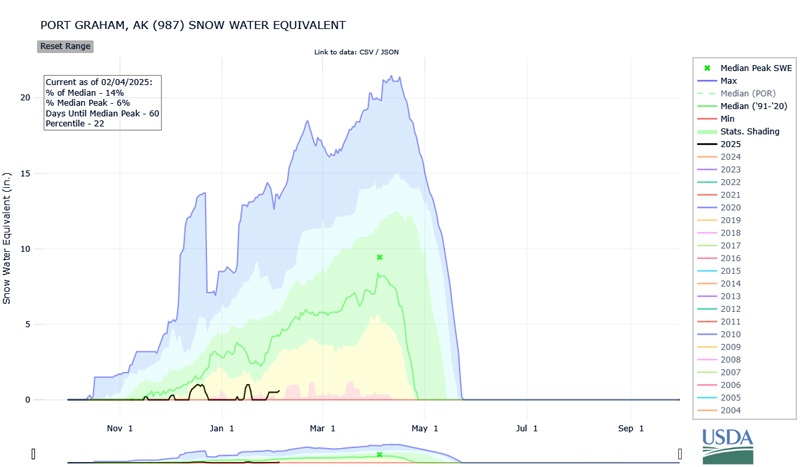
Snow drought conditions persist at lower elevations, with improvements to snow drought conditions (but still below normal for some locations) at higher elevations. The Kenai Peninsula HUC 6 Basin is a good example of this: the SNOTEL station at Port Graham (170-foot elevation) is at 14% of median, whereas the Turnagain Pass (1,860-foot elevation) station is reporting 135% of median. Anchorage Airport, at sea level, is reporting a trace of snow depth as of February 2. Precipitation at Anchorage Airport in January was the fourth highest on record,and snowfall was the sixth lowest. The January temperature anomaly was 9.8° Fahrenheit (F) above normal.
Snowpack is still above normal in the Fairbanks region and surrounding mountains despite a very warm January. The January temperature at the Fairbanks airport was 14.6°F above normal, but the mean maximum temperature for the month was still just 15.7°F. The limited SWE observations in the Panhandle indicate much-below-normal snowpack around the Juneau area. The February 1 snow survey reported 47%, 40%, and 60% of normal SWE at Cropley Lake, Eagle Crest, and Fish Creek survey locations, respectively. The Long Lake SNOTEL is reporting 58% of normal SWE (16th percentile).
Port Graham, Alaska Snow Water Equivalent
Key Takeaway: Snow drought in the Kenai Peninsula persists at low elevations due to very warm temperatures that have caused rain at low elevations, limiting snowpack gains, and in some cases causing snowmelt.
* Quantifying snow drought values is an ongoing research effort. Here we have used the 30th percentile as a starting point based on partner expertise and research. Get more information on the current definition of snow drought.
For More Information, Please Contact:
Daniel McEvoy
Western Regional Climate Center
Daniel.McEvoy@dri.edu
Gretel Follingstad
CIRES/NOAA/NIDIS Intermountain West Regional Drought Information Coordinator
Gretel.Follingstad@noaa.gov
Jason Gerlich
CIRES/NOAA/NIDIS Pacific Northwest and Missouri River Basin Regional Drought Information Coordinator
Jason.Gerlich@noaa.gov
Amanda Sheffield
CIRES/NOAA/NIDIS California-Nevada Regional Drought Information Coordinator
Amanda.Sheffield@noaa.gov
NIDIS and its partners launched this snow drought effort in 2018 to provide data, maps, and tools for monitoring snow drought and its impacts as well as communicating the status of snow drought across the United States, including Alaska. Thank you to our partners for your continued support of this effort and review of these updates. If you would like to report snow drought impacts, please use the link below. Information collected will be shared with the states affected to help us better understand the short term, long term, and cumulative impacts of snow drought to the citizens and the economy of the regions reliant on snowpack.
Report Your Snow Drought Impacts
Data and Maps | Snow Drought
Research and Learn | Snow Drought