Abysmal Snowpack Defines Winter for Arizona and New Mexico
Key Points
- Another month of extremely dry conditions plagued the Southwest (Colorado, New Mexico, Arizona, Utah, Nevada), leading to deepening snow deficits across already dry basins. Exceptional snow drought continues to persist with the peak snow water equivalent (SWE) dates past for Arizona and New Mexico.
- Lower-elevation snow drought persisted across southern Alaska due to continued warm and dry conditions, with Anchorage Airport recording its driest February on record. Large areas in southwest Alaska and low elevations in south-central Alaska—which are typically snow covered—were (nearly) snow-free as of March 1.
- Moderate snow drought conditions persisted in the northern and central Cascade Range of Washington due to below-average winter precipitation.
- A recent storm cycle brought welcome moisture back to California and Nevada, improving snow drought conditions, but deficits still remain in the region.
- The Upper San Juan, Upper Rio Grande, and Gunnison River Basins provide substantial snowmelt and runoff to the Upper Colorado River Basin, which drains into Lake Powell. Given low snowpack in these basins, monitoring snow conditions will be critical for future water supply as the basins enter the spring snowmelt season.
- The National Weather Service Climate Prediction Center’s outlooks favor a likely colder and wetter pattern over the next month in the West, which could be favorable for snow accumulation.
Snow Telemetry (SNOTEL) snow water equivalent (SWE) values for watersheds in the western U.S. as a percentage of the 1991–2020 median recorded by the USDA Natural Resources Conservation Service (NRCS). Only stations with at least 20 years of data are included in the station averages.
The SWE percent of median, in this figure and in the text, represents the current SWE at selected SNOTEL stations in or near the basin compared to the median value for those stations on the same date from 1991–2020. This map is valid through the end of the day March 2, 2025.
For an interactive version of this map, please visit NRCS.
Snow Telemetry (SNOTEL) and snow course snow water equivalent (SWE) values for watersheds in Alaska as a percentage of the 1991–2020 median recorded by the USDA Natural Resources Conservation Service (NRCS). Only stations with at least 20 years of data are included in the station averages.
The SWE percentage of median, in this figure and in the text, represents the current SWE at selected SNOTEL stations in or near the basin compared to the median value for those stations on the same date. This map is valid through the end of the day March 2, 2025.
For an interactive version of this map, please visit NRCS.
Drought is defined as the lack of precipitation over an extended period of time, usually for a season or more, that results in a water shortage. Changes in precipitation can substantially disrupt crops and livestock, influence the frequency and intensity of severe weather events, and affect the quality and quantity of water available for municipal and industrial use.
Learn MoreSnow drought is a period of abnormally low snowpack for the time of year. Snowpack typically acts as a natural reservoir, providing water throughout the drier summer months. Lack of snowpack storage, or a shift in timing of snowmelt, can be a challenge for drought planning.
Learn MorePeriods of drought can lead to inadequate water supply, threatening the health, safety, and welfare of communities. Streamflow, groundwater, reservoir, and snowpack data are key to monitoring and forecasting water supply.
Learn MoreIn a drought, lower water levels or snowpack can affect the availability of recreational activities and associated tourism, and a resulting loss of revenue can severely impact supply chains and the economy. Drought—as well as negative perceptions of drought, fire bans, or wildfires—may also result in decreased visitations, cancellations in hotel stays, a reduction in booked holidays, or reduced merchandise sales.
Learn MoreDrought is defined as the lack of precipitation over an extended period of time, usually for a season or more, that results in a water shortage. Changes in precipitation can substantially disrupt crops and livestock, influence the frequency and intensity of severe weather events, and affect the quality and quantity of water available for municipal and industrial use.
Learn MoreSnow drought is a period of abnormally low snowpack for the time of year. Snowpack typically acts as a natural reservoir, providing water throughout the drier summer months. Lack of snowpack storage, or a shift in timing of snowmelt, can be a challenge for drought planning.
Learn MorePeriods of drought can lead to inadequate water supply, threatening the health, safety, and welfare of communities. Streamflow, groundwater, reservoir, and snowpack data are key to monitoring and forecasting water supply.
Learn MoreIn a drought, lower water levels or snowpack can affect the availability of recreational activities and associated tourism, and a resulting loss of revenue can severely impact supply chains and the economy. Drought—as well as negative perceptions of drought, fire bans, or wildfires—may also result in decreased visitations, cancellations in hotel stays, a reduction in booked holidays, or reduced merchandise sales.
Learn MorePercent of Median Snow Water Equivalent
< 50% of Median
Current snow water equivalent (SWE) is less than 50% of the median SWE value for this day of the year, compared to historical conditions from 1991–2020.
50%–70% of Median
Current snow water equivalent (SWE) is between 50%–70% of the median SWE value for this day of the year, compared to historical conditions from 1991–2020.
70%–90% of Median
Current snow water equivalent (SWE) is between 70%–90% of the median SWE value for this day of the year, compared to historical conditions from 1991–2020.
90%–110% of Median
Current snow water equivalent (SWE) is between 90%–110% of the median SWE value for this day of the year, compared to historical conditions from 1991–2020.
110%–130% of Median
Current snow water equivalent (SWE) is between 110%–130% of the median SWE value for this day of the year, compared to historical conditions from 1991–2020.
130%–150% of Median
Current snow water equivalent (SWE) is between 130%–150% of the median SWE value for this day of the year, compared to historical conditions from 1991–2020.
>150% of Median
Current snow water equivalent (SWE) is greater than 150% of the median SWE value for this day of the year, compared to historical conditions from 1991–2020.
Percent of Median Snow Water Equivalent
< 50% of Median
Current snow water equivalent (SWE) is less than 50% of the median SWE value for this day of the year, compared to historical conditions from 1991–2020.
50%–70% of Median
Current snow water equivalent (SWE) is between 50%–70% of the median SWE value for this day of the year, compared to historical conditions from 1991–2020.
70%–90% of Median
Current snow water equivalent (SWE) is between 70%–90% of the median SWE value for this day of the year, compared to historical conditions from 1991–2020.
90%–110% of Median
Current snow water equivalent (SWE) is between 90%–110% of the median SWE value for this day of the year, compared to historical conditions from 1991–2020.
110%–130% of Median
Current snow water equivalent (SWE) is between 110%–130% of the median SWE value for this day of the year, compared to historical conditions from 1991–2020.
130%–150% of Median
Current snow water equivalent (SWE) is between 130%–150% of the median SWE value for this day of the year, compared to historical conditions from 1991–2020.
>150% of Median
Current snow water equivalent (SWE) is greater than 150% of the median SWE value for this day of the year, compared to historical conditions from 1991–2020.
Snow Telemetry (SNOTEL) snow water equivalent (SWE) values for watersheds in the western U.S. as a percentage of the 1991–2020 median recorded by the USDA Natural Resources Conservation Service (NRCS). Only stations with at least 20 years of data are included in the station averages.
The SWE percent of median, in this figure and in the text, represents the current SWE at selected SNOTEL stations in or near the basin compared to the median value for those stations on the same date from 1991–2020. This map is valid through the end of the day March 2, 2025.
For an interactive version of this map, please visit NRCS.
Snow Telemetry (SNOTEL) and snow course snow water equivalent (SWE) values for watersheds in Alaska as a percentage of the 1991–2020 median recorded by the USDA Natural Resources Conservation Service (NRCS). Only stations with at least 20 years of data are included in the station averages.
The SWE percentage of median, in this figure and in the text, represents the current SWE at selected SNOTEL stations in or near the basin compared to the median value for those stations on the same date. This map is valid through the end of the day March 2, 2025.
For an interactive version of this map, please visit NRCS.
View an updated, interactive version of this map from the USDA's Natural Resources Conservation Service. You can also view SWE data on Drought.gov.
View an updated, interactive version of this map from the USDA's Natural Resources Conservation Service. You can also view SWE data on Drought.gov.
Drought is defined as the lack of precipitation over an extended period of time, usually for a season or more, that results in a water shortage. Changes in precipitation can substantially disrupt crops and livestock, influence the frequency and intensity of severe weather events, and affect the quality and quantity of water available for municipal and industrial use.
Learn MoreSnow drought is a period of abnormally low snowpack for the time of year. Snowpack typically acts as a natural reservoir, providing water throughout the drier summer months. Lack of snowpack storage, or a shift in timing of snowmelt, can be a challenge for drought planning.
Learn MorePeriods of drought can lead to inadequate water supply, threatening the health, safety, and welfare of communities. Streamflow, groundwater, reservoir, and snowpack data are key to monitoring and forecasting water supply.
Learn MoreIn a drought, lower water levels or snowpack can affect the availability of recreational activities and associated tourism, and a resulting loss of revenue can severely impact supply chains and the economy. Drought—as well as negative perceptions of drought, fire bans, or wildfires—may also result in decreased visitations, cancellations in hotel stays, a reduction in booked holidays, or reduced merchandise sales.
Learn MoreDrought is defined as the lack of precipitation over an extended period of time, usually for a season or more, that results in a water shortage. Changes in precipitation can substantially disrupt crops and livestock, influence the frequency and intensity of severe weather events, and affect the quality and quantity of water available for municipal and industrial use.
Learn MoreSnow drought is a period of abnormally low snowpack for the time of year. Snowpack typically acts as a natural reservoir, providing water throughout the drier summer months. Lack of snowpack storage, or a shift in timing of snowmelt, can be a challenge for drought planning.
Learn MorePeriods of drought can lead to inadequate water supply, threatening the health, safety, and welfare of communities. Streamflow, groundwater, reservoir, and snowpack data are key to monitoring and forecasting water supply.
Learn MoreIn a drought, lower water levels or snowpack can affect the availability of recreational activities and associated tourism, and a resulting loss of revenue can severely impact supply chains and the economy. Drought—as well as negative perceptions of drought, fire bans, or wildfires—may also result in decreased visitations, cancellations in hotel stays, a reduction in booked holidays, or reduced merchandise sales.
Learn MoreSnow Drought Conditions Summary
This update is based on data available as of Monday, March 3, 2025 at 12:00 a.m. PT. We acknowledge that conditions are evolving.
Current Conditions
Extremely dry conditions across the West in January transitioned to a more active precipitation pattern in February improving the snowpack for much of the West, particularly in the Sierra Nevada, northern Great Basin, and northern Rocky Mountains. In contrast, much of the southern Rocky Mountains, Arizona, and New Mexico saw very little snowfall over the past month. The worst snow drought conditions continue to be in the Southwest, including southern Utah, southwestern Colorado, Arizona, and New Mexico. Snow drought conditions also persist in the northern and central Cascade Range of Washington.
Looking Ahead
The U.S. Bureau of Reclamation weekly water supply report for the Lower Colorado River Basin predicts unregulated inflows into Lake Powell will be 70% of normal in April–July. This is despite 92% of normal snow water equivalent (SWE) in the Upper Colorado Basin, as Colorado river tributary watersheds across central Utah (the San Juan River Basin, the Green Basin, and Gunnison Basin) saw below-normal precipitation and persistent low soil moisture conditions. Spring storms could help boost snowpack, but erasing the deep seasonal deficits across these basins is unlikely.
Throughout Arizona and New Mexico, above-normal potential for significant wildfires persists through June, according to the National Interagency Fire Center. Wildfire season generally begins earlier and peaks later in these states compared to other areas of the West due to earlier peak SWE and a climatologically dry spring before the monsoon season begins.
Jump to conditions for your region:
- Colorado, Idaho, Montana, Utah, Wyoming (Rocky Mountains) Snow Conditions
- Arizona and New Mexico Snow Conditions
- Oregon and Washington Snow Conditions
- California and Nevada Snow Conditions
- Alaska Snow Conditions
Several Western U.S. Stations Have SWE Below the 30th Percentile
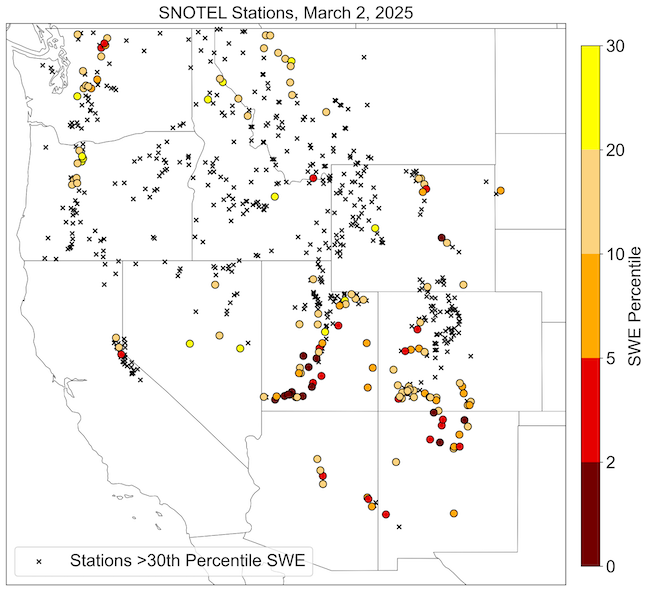
Dry Snow Conditions Across Basins in the Southwestern U.S.

Rocky Mountain Snow Conditions (Colorado, Idaho, Montana, Utah, Wyoming)
Northern Rockies
Snowpack has generally improved in the northern Rocky Mountains over the past month, with most hydrologic unit code (HUC) 6 basins reporting near- to above-normal snow water equivalent (SWE). However, the Marias and Upper South Saskatchewan Basins in northwestern Montana are still in snow drought, with SWE at 71% and 73% of normal, respectively. Precipitation over most of the Bighorn Mountains in north-central Wyoming was well below normal over the past month, particularly the southern part of the range. Snow drought conditions are present in the central and southern part of the Bighorn Mountains, where SNOTEL stations are reporting 48–92% of normal SWE.
Central Rockies
Snow drought conditions have persisted and, in some cases, intensified across central and southern Utah and southwestern Colorado. Thirteen SNOTEL stations scattered across south-central and southwest Utah report record-low snow water equivalent (SWE). The Lower Colorado-Lake Mead, Escalante Desert-Sevier Lake, and Upper Colorado-Dirty Devil Basins have 29%, 51%, and 56% of normal SWE, respectively. This is the lowest SWE on record for the Lower Colorado-Lake Mead Basin for this date. The Lower Green Basin, including the south slopes of the Uinta Mountains in northeastern Utah, report 79% of normal SWE.
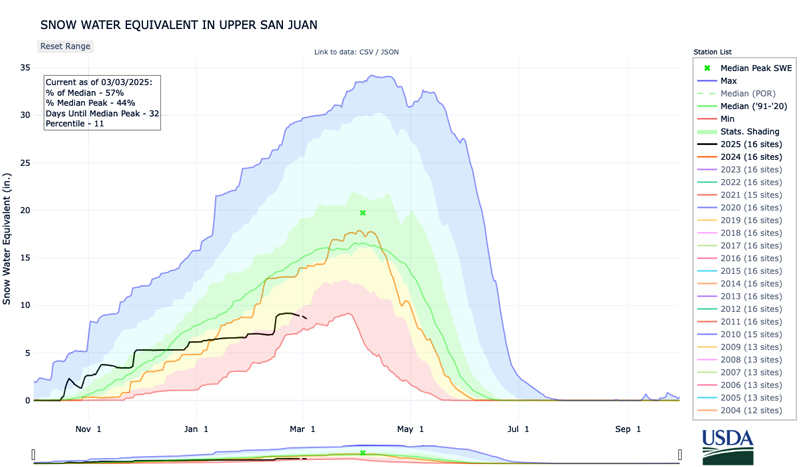
SNOTEL stations in southwestern Colorado, including stations in the San Juan and Sangre de Cristo mountains, also report snow drought conditions, with most locations below the 20th percentile SWE. Northwestern portions of the Gunnison Basin also have well-below-normal snowpack. The Upper San Juan, Rio Grande Headwaters, and Gunnison Basins are at 56%, 62%, and 82% of normal SWE, respectively. These basins provide substantial snowmelt and runoff to the Upper Colorado River Basin, which drains into Lake Powell. It will be critical to watch snowpack in these basins heading into the spring snowmelt season. February temperatures were 4–6 °F above normal in much of southern Utah and western Colorado, helping drive snow drought across the region.
Low Snow Water Equivalent in Upper San Juan River Basin
Arizona and New Mexico Snow Conditions
Snow drought conditions remain severe as much of the region is nearing or has passed the dates at which snow water equivalent (SWE) typically peaks for the year. In Arizona and parts of New Mexico, peak SWE typically occurs around March 1, much earlier than most of the mountains in the West. The trend of persistent above-normal temperatures and lack of snowfall continued in February in the mountains across the region.
All but two SNOTEL stations in Arizona and New Mexico report less than 50% of normal SWE, with no snow at some locations. In Arizona, the Verde Basin, which has a median peak SWE date of March 1, is currently at 8% of median peak SWE, and the Little Colorado Basin, which has a median peak SWE date of March 4, is currently at 17% of median peak SWE. In New Mexico, the Upper Rio Grande and Upper Canadian Basins are at 39% and 28% of normal SWE, respectively.
Initial surges of spring snowmelt already occurred at some locations in the Upper Canadian Basin, which is several weeks earlier than normal. February temperatures were 4–6 °F above normal across much of the region, which contributed to increased snowmelt at lower elevations.
Oregon and Washington Snow Conditions
Snow drought conditions are variable throughout Oregon and Washington, with areas of snow drought in the northern and central Washington Cascade Range and at elevations below 4,000 feet in the northern Oregon Cascade Range. Elsewhere, snow water equivalent (SWE) levels are generally much above normal in the Blue Mountains and the southern Oregon Cascade Range.
Most SNOTEL stations in the central and northern Cascade Range of Washington report well-below-normal SWE. Several stations on the east slope along the North Cascades Highway (SR 20) report SWE below the 10th percentile; similarly, a cluster of stations along I-90 report SWE below the 15th percentile, including Stampede Pass (7th percentile).
At the regional scale, the Puget Sound Basin and Upper Columbia Basin are reporting 77% and 81% of normal SWE, respectively. In the southern Washington Cascade Range, including the Lower Columbia and Yakima Basins, snowpack is generally near-to-slightly below normal.
In Oregon, stations below 4,000 feet along the west slope of the Cascade Range in the Willamette Basin report much-below normal snowpack, with several SNOTEL stations reporting SWE below the 20th percentile and less than 50% of normal, including Daly Lake at 3690 feet (16th percentile), Marion Forks at 2590 feet (11th percentile), Blazed Alder at 3660 feet (12th percentile), and Peavine Ridge at 3420 feet (14th percentile). SWE loss at these lower elevation stations was partly caused by a warm rain-on-snow event associated with an atmospheric river in late February. At higher elevations and closer to the Cascade crest, SWE is near normal. Based on 19 SNOTEL stations at varying elevations, the Willamette Basin is reporting 92% of normal SWE.
California and Nevada Snow Conditions
Stormy conditions returned to California and Nevada in February, with increases in snowpack and improvements to snow drought conditions relative to early February. However, some areas of snow drought remain, particularly in the southern Sierra Nevada and at lower elevations throughout the Sierra Nevada.
Several moderate strength storms impacted the Sierra Nevada in February. These storms boosted the snowpack but favored the northern and central Sierra Nevada, with less precipitation in the southern Sierra Nevada. This pattern is reflected in California Department of Water Resources snow pillow data: the northern Sierra Nevada is at 104% of normal snow water equivalent (SWE), central Sierra Nevada at 80% of normal SWE, and southern Sierra Nevada at 70% of normal SWE. SNOTEL data from the eastern Sierra Nevada show basins at 83–85% of normal SWE. Early February storms were warm and brought heavy rainfall to lower elevations in the Sierra Nevada. Snow pillow data show this, with little to no snow at low elevations around Lake Tahoe and along the west slope of the Sierra Nevada.
Northeastern Nevada continues to have a good snow season, with above-normal SWE throughout the region. However, SNOTEL stations along the I-50 corridor in central and eastern Nevada are at 57–86% of normal SWE.
Alaska Snow Conditions
It was a dry month with below-normal precipitation and snowfall for most of Alaska. South-central Alaska was particularly dry, and snow drought conditions are present at lower elevations throughout the region. Anchorage Airport had its driest February on record, with just 0.03 inches of precipitation and no measurable snow depth in February, for the first time since records began in 1953.
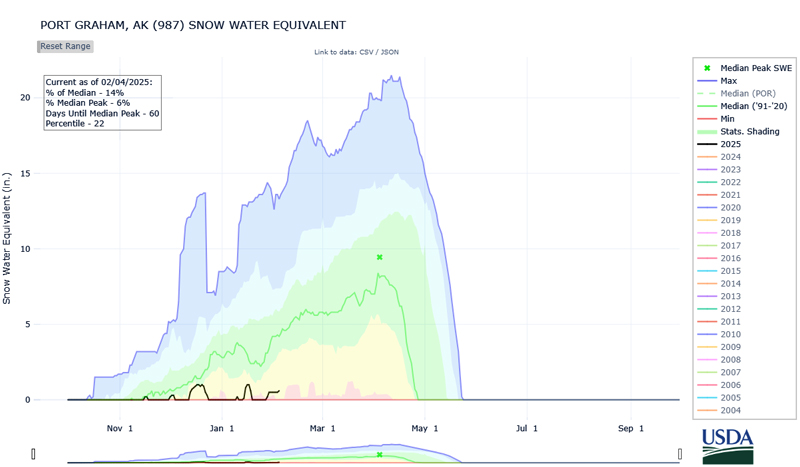
The Kenai Peninsula is experiencing snow drought conditions, with lower elevations reporting an extremely low to non-existent snowpack and upper elevations reporting near-normal snowpack. For example, Portage Valley (60-feet elevation) is snow-free for the first time since 2016, while Turnagain Pass (1,860-feet elevation) is currently at 108% of normal snow water equivalent (SWE).
Snowfall and SWE data are limited in southeast Alaska, but observations around the Juneau area suggest below-normal snowpack in the region. The Long Lake SNOTEL is currently at 58% of normal SWE. The Juneau Airport had below-normal precipitation and just 0.01 inches of snowfall in February. Normal February snowfall is 16.7 inches.
Low Snow Water Equivalent in Alaska’s Kenai Peninsula
* Quantifying snow drought values is an ongoing research effort. Here we have used the 30th percentile as a starting point based on partner expertise and research. Get more information on the current definition of snow drought.
For More Information, Please Contact:
Daniel McEvoy
Western Regional Climate Center
Daniel.McEvoy@dri.edu
Gretel Follingstad
CIRES/NOAA/NIDIS Intermountain West Regional Drought Information Coordinator
Gretel.Follingstad@noaa.gov
Jason Gerlich
CIRES/NOAA/NIDIS Pacific Northwest and Missouri River Basin Regional Drought Information Coordinator
Jason.Gerlich@noaa.gov
Amanda Sheffield
CIRES/NOAA/NIDIS California-Nevada Regional Drought Information Coordinator
Amanda.Sheffield@noaa.gov
NIDIS and its partners launched this snow drought effort in 2018 to provide data, maps, and tools for monitoring snow drought and its impacts as well as communicating the status of snow drought across the United States, including Alaska. Thank you to our partners for your continued support of this effort and review of these updates. If you would like to report snow drought impacts, please use the link below. Information collected will be shared with the states affected to help us better understand the short term, long term, and cumulative impacts of snow drought to the citizens and the economy of the regions reliant on snowpack.
Report Your Snow Drought Impacts
Data and Maps | Snow Drought
Research and Learn | Snow Drought