Historical Data and Conditions
By looking back at historical data, communities can get a better understanding of the drought and extreme weather threats to be prepared for. The resources below help document and quantify historical drought conditions in order to help inform planning. Three historical drought datasets can be explored side by side: the U.S. Drought Monitor (weekly, 2000–present); Standardized Precipitation Index (monthly, 1895–present); and June-July-August Palmer Modified Drought Index values from tree-ring reconstructions and instrumental data (yearly, 0–2017).
of the U.S. was in drought in September 2012, according to the U.S. Drought Monitor record since 2000
of the lower 48 states were in drought in Summer 1934, the most in the lower 48, according to the Living Blended Drought Product since year 0
of the U.S. was in Exceptional Drought (D4) in February 1977, according to the Standardized Precipitation Index (SPI) since 1895
of the U.S. was Abnormally Wet in May 2019, the most according to the Standardized Precipitation Index (SPI) since 1895
Explore Historical Drought Conditions
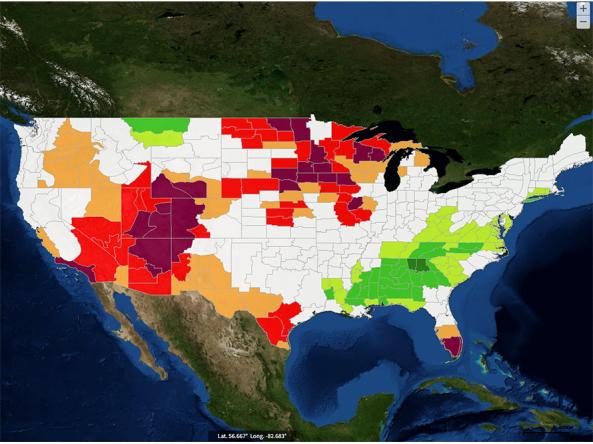
U.S. Drought Monitor Category
% of U.S.Abnormally Dry
Abnormally Dry (D0) indicates a region that is going into or coming out of drought.
Moderate Drought
Moderate Drought (D1) is the first of four drought categories (D1–D4), according to the U.S. Drought Monitor.
Severe Drought
Severe Drought (D2) is the second of four drought categories (D1–D4), according to the U.S. Drought Monitor.
Extreme Drought
Extreme Drought (D3) is the third of four drought categories (D1–D4), according to the U.S. Drought Monitor.
Exceptional Drought
Exceptional Drought (D4) is the most intense drought category, according to the U.S. Drought Monitor.
Total Area in Drought (D1–D4)
Percent area of the 50 U.S. states and Puerto Rico that is currently in drought (D1–D4), according to the U.S. Drought Monitor.
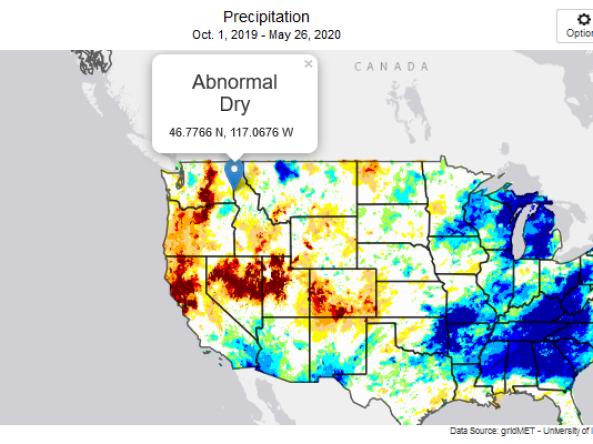
9-Month Standardized Precipitation Index (SPI)
% of U.S.W4 (SPI of 2.0 or more)
The Standardized Precipitation Index (SPI) value for this location is 2.0 or greater, indicating exceptional wet (W4) conditions.
W3 (SPI of 1.6 to 1.9)
The Standardized Precipitation Index (SPI) value for this location is between 1.6 to 1.9, indicating extreme wet (W3) conditions.
W2 (SPI of 1.3 to 1.5)
The Standardized Precipitation Index (SPI) value for this location is between 1.3 to 1.5, indicating severe wet (W2) conditions.
W1 (SPI of 0.8 to 1.2)
The Standardized Precipitation Index (SPI) value for this location is between 0.8 to 1.2, indicating moderate wet (W1) conditions.
W0 (SPI of 0.5 to 0.7)
The Standardized Precipitation Index (SPI) value for this location is between 0.5 to 0.7, indicating abnormally wet (W0) conditions.
D0 (SPI of -0.7 to -0.5)
The Standardized Precipitation Index (SPI) value for this location is between -0.7 to -0.5, indicating abnormally dry (D0) conditions.
D1 (SPI of -1.2 to -0.8)
The Standardized Precipitation Index (SPI) value for this location is between -1.2 to -0.8, indicating moderate drought (D1) conditions.
D2 (SPI of -1.5 to -1.3)
The Standardized Precipitation Index (SPI) value for this location is between -1.5 to -1.3, indicating severe drought (D2) conditions.
D3 (SPI of -1.9 to -1.6)
The Standardized Precipitation Index (SPI) value for this location is between -1.9 to -1.6, indicating extreme drought (D3) conditions.
D4 (SPI of -2.0 or less)
The 9-month Standardized Precipitation Index (SPI) value for this location is -2.0 or less, indicating exceptional drought (D4) conditions.
No Data Available
Palmer Modified Drought Index (PMDI) - Paleoclimate Data
% of U.S.W4 (PMDI of 5.0 or greater)
Tree rings were used to reconstruct a Palmer Modified Drought Index (PMDI) value for each June–August, estimating relative dryness. The PMDI value for this location is 5.0 or greater, indicating exceptional wet (W4) conditions.
W3 (PMDI of 4.0 to 4.9)
Tree rings were used to reconstruct a Palmer Modified Drought Index (PMDI) value for each June–August, estimating relative dryness. The PMDI value for this location is 4.0 to 4.9, indicating extreme wet (W3) conditions.
W2 (PMDI of 3.0 to 3.9)
Tree rings were used to reconstruct a Palmer Modified Drought Index (PMDI) value for each June–August, estimating relative dryness. The PMDI value for this location is 3.0 to 3.9, indicating severe wet (W2) conditions.
W1 (PMDI of 2.0 to 2.9)
Tree rings were used to reconstruct a Palmer Modified Drought Index (PMDI) value for each June–August, estimating relative dryness. The PMDI value for this location is 2.0 to 2.9, indicating moderate wet (W1) conditions.
W0 (PMDI of 1.0 to 1.9)
Tree rings were used to reconstruct a Palmer Modified Drought Index (PMDI) value for each June–August, estimating relative dryness. The PMDI value for this location is 1.0 to 1.9, indicating abnormally wet (W0) conditions.
D0 (PMDI of -1.9 to -1.0)
Tree rings were used to reconstruct a Palmer Modified Drought Index (PMDI) value for each June–August, estimating relative dryness. The PMDI value for this location is -1.9 to -1.0, indicating abnormally dry (D0) conditions.
D1 (PMDI of -2.9 to -2.0)
Tree rings were used to reconstruct a Palmer Modified Drought Index (PMDI) value for each June–August, estimating relative dryness. The PMDI value for this location is -2.9 to -2.0, indicating moderate drought (D1) conditions.
D2 (PMDI of -3.9 to -3.0)
Tree rings were used to reconstruct a Palmer Modified Drought Index (PMDI) value for each June–August, estimating relative dryness. The PMDI value for this location is -3.9 to -3.0, indicating severe drought (D2) conditions.
D3 (PMDI of -4.9 to -4.0)
Tree rings were used to reconstruct a Palmer Modified Drought Index (PMDI) value for each June–August, estimating relative dryness. The PMDI value for this location is -4.9 to -4.0, indicating extreme drought (D3) conditions.
D4 (PMDI of -5.0 or less)
Tree rings were used to reconstruct a Palmer Modified Drought Index (PMDI) value for each June–August, estimating relative dryness. The PMDI value for this location is -5.0 or less, indicating exceptional drought (D4) conditions.
No Data Available
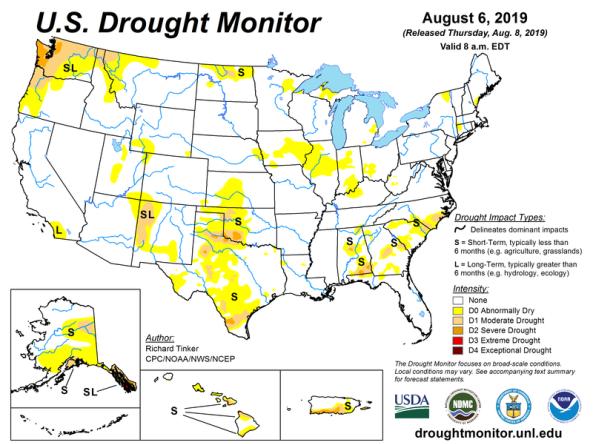
The U.S. Drought Monitor (2000–present) depicts the location and intensity of drought across the country. Every Thursday, authors from NOAA, USDA, and the National Drought Mitigation Center produce a new map based on their assessments of the best available data and input from local observers. The map uses five categories: Abnormally Dry (D0), showing areas that may be going into or are coming out of drought, and four levels of drought (D1–D4). Learn more.
Drought results from an imbalance between water supply and water demand. The Standardized Precipitation Index (SPI) measures water supply, specifically precipitation. SPI captures how observed precipitation (rain, hail, snow) deviates from the climatological average over a given time period—in this case, over the 9 months leading up to the selected date. Red hues indicate drier conditions, while blue hues indicate wetter conditions. Data are available monthly from 1895–present. Learn more.
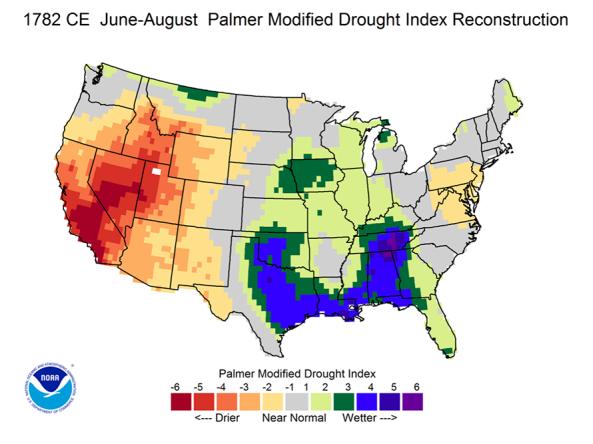
In paleoclimatology, proxy climate data (e.g., tree rings, ocean sediments) can allow us to reconstruct past climate conditions before we had widespread instrumental records. By combining tree-ring reconstructions and instrumental records, the Living Blended Drought Atlas estimates average drought conditions (the Palmer Modified Drought Index, or PMDI, shown here) for each June–August as far back as the year 0. Red hues indicate drier conditions, while blue hues indicate wetter conditions.
NOAA and its partners publish regional reports each quarter, summarizing weather, impacts and predictions.
The Living Blended Drought Atlas (LBDA) is a recalibrated data series of June-July-August Palmer Modified Drought Index (PMDI) values by United States climate division, compiled by blending tree-ri
NCEI provides the paleoclimatology data and information scientists need to understand natural climate variability and future climate change.
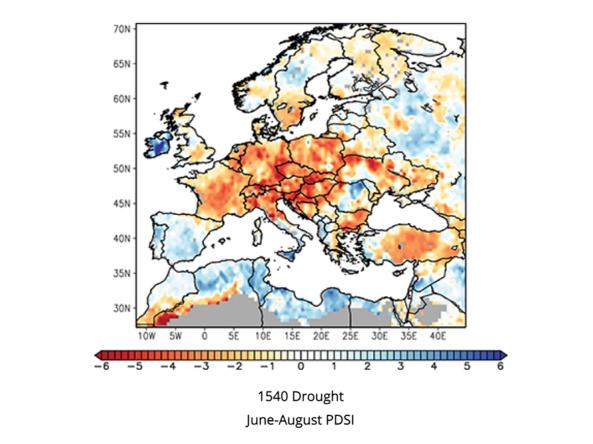
The OWDA provides new data to determine the causes of Old World drought and wetness and attribute past climate variability to forced and/or internal variability.
Global Historical Climatology Network (GHCN): an integrated database of daily climate summaries from land surface stations across the globe, including a common suite of quality assurance reviews.&n
This tool, available as part of The Climate Toolbox, provides maps and summary tables of different drought types, such as agricultural and meteorological drought, for a location in the contiguous U