Monitor Heat and Drought with New Tools on Drought.gov
New interactive maps on Drought.gov can help users better prepare for heat and drought in their communities, with data from NOAA’s National Weather Service. Drought.gov now displays customizable maps showing National Weather Service heat advisories, warnings, and watches, as well as 3–7 and 8–14 day heat hazard outlooks. These maps can be overlaid with the U.S. Drought Monitor to monitor areas where extreme heat may worsen existing drought conditions.
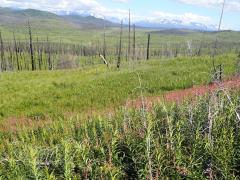
These maps provide information about drought and heat at a local level, which in turn can help users prepare for the possible impacts of heat and drought. These impacts can include increased chances of wildfire starts, more severe wildfires, poor air quality, damage to crops and yards, and harm to human health.
How Do Heat and Drought Interact?
Heat and drought can affect each other. High temperatures can intensify drought conditions, and drought (or dry landscapes) can lead to higher temperatures.
Drought can amplify heat waves. When water evaporates, it has a cooling effect on the air nearest the ground. During prolonged dry periods and drought, evaporation rates are limited by the amount of water in the landscape. Without that cooling effect, what could have been simply a hot day can become a very hot day.
High temperatures can also worsen drought. At warmer temperatures, the atmosphere can hold more water. That means a thirstier atmosphere draws more water from evaporation and transpiration from plants. This atmospheric demand for water, called atmospheric evaporative demand, can dry out streams, soils, and plants. When the evaporative demand exceeds the supply of precipitation, dry conditions can take hold and worsen, leading to drought. Historically, droughts have often been driven by periods of lower precipitation. However, as temperatures have increased over the last 40 years, heat is more often increasing atmospheric demand in parts of the U.S., creating or worsening drought conditions.
Heat and drought can also create or intensify other impacts. Hot and dry conditions can lead to decreased streamflow, dry soils, and large-scale tree deaths. This creates increased potential for extreme wildfires that spread rapidly, burn with more severity, and are costly to suppress.
Drought can also reduce water supplies vital to generate electricity, while extreme heat often creates additional demand for energy to cool buildings. When drought and heat are present at the same time, the energy grid can face stress as it may produce less power due to decreased water supplies while it faces a greater demand for energy to run air conditioners and other cooling systems.
Stay Ahead of the Heat
The National Weather Service issues heat advisories, watches, or warnings when hazardous heat conditions are imminent based on the heat index for a given location, while also considering regional factors and potential impacts. For instance, residents of Florida are much more prepared for 90°F+ weather than residents in Alaska. The National Weather Service also issues heat hazard outlooks, predicting the risk of dangerous heat conditions up to 2 weeks out.
The new maps on Drought.gov allow users to visualize both current and future heat conditions on interactive, easy to download maps. These maps can be overlaid with the current U.S. Drought Monitor to better understand which communities are experiencing both hazards. Users can also zoom in on a region and overlay tribal land boundaries and counties to customize the map to the areas they are most interested in. Just click the “Customize & Download Map” icon (gear with an arrow) on the top left corner of each map to customize it.
Today up to 3 days ahead:
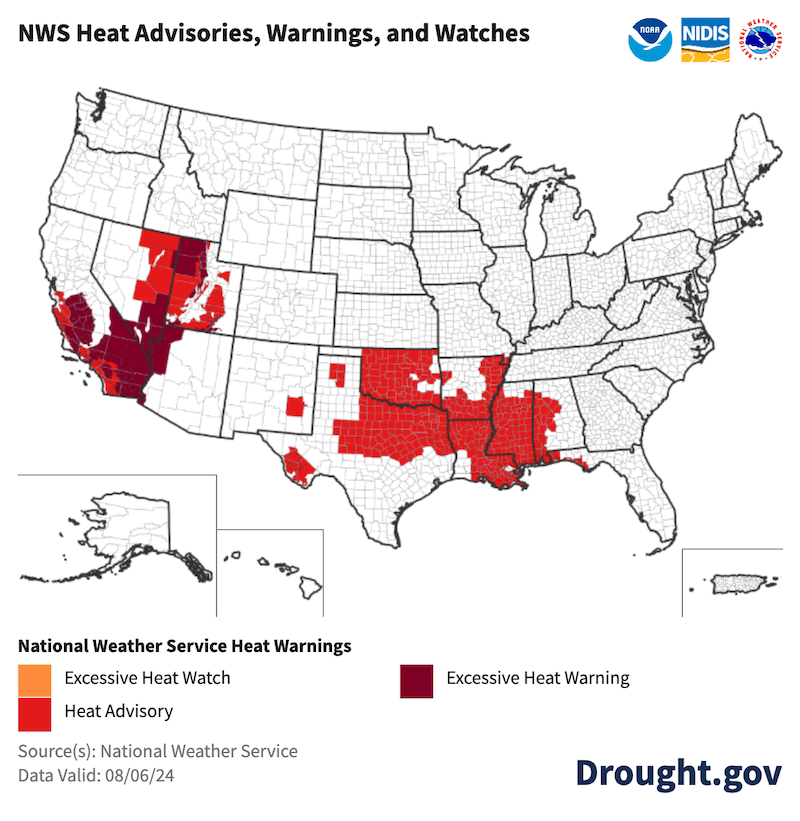
The National Weather Service issues heat warnings, watches, and advisories within 12 to 72 hours of anticipated extremely dangerous heat conditions:
- Excessive Heat Watches are issued when conditions are favorable for an excessive heat event in the next 24 to 72 hours. A Watch is used when the risk of a heat wave has increased, but its occurrence and timing are still uncertain.
- Heat Advisories are issued within 12 hours of the onset of extremely dangerous heat conditions, generally, when maximum heat index temperature is expected to be 100°F or higher for at least 2 days. However, these criteria vary across the country.
- Excessive Heat Warnings are issued within 12 hours of the onset of extremely dangerous heat conditions, generally, when the maximum heat index temperature is expected to be 105°F or higher for at least 2 days. However, these criteria also vary across the country.
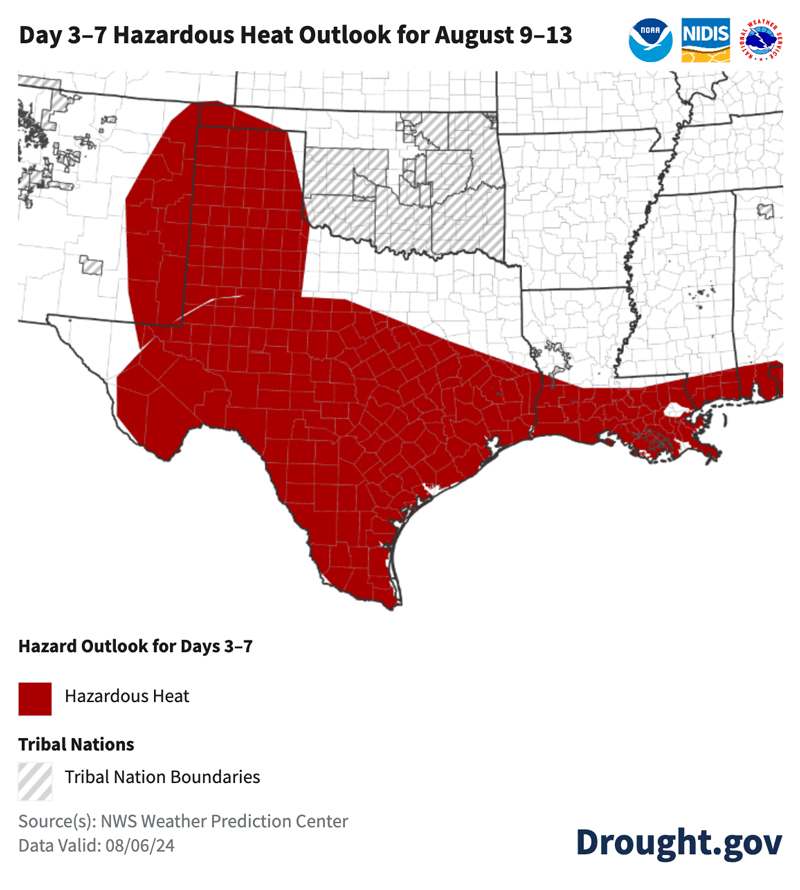
3 days to a week ahead:
The National Weather Service Weather Prediction Center's Day 3–7 U.S. Hazards Outlook shows the risk of hazardous heat 3 to 7 days from now. Hazardous heat risk areas shaded on the map typically indicate a 40% or higher chance of exceeding NWS Heat Advisory criteria.
8 to 14 days ahead:
The National Weather Service Climate Prediction Center's Day 8–14 U.S. Hazards Outlook shows the risk of excessive heat for the following week (8 to 14 days from now). Areas shaded on the map face a 40% or higher chance of exceeding NWS Heat Advisory criteria.
Check out Drought.gov’s Outlooks & Forecasts page to view both heat hazard outlook maps. Or, you can find current NWS heat advisories, warnings, and watches on the Public Health and Hazard Planning & Preparedness pages.
Additional information to help prepare for, better understand, and track the impact of heat on human health is available on heat.gov.