Drought Impacts Increase Across California-Nevada and Concern for Wildfire Potential Grows.
Key Points
- After 2 water years of dry conditions, both California and Nevada are now 100% in moderate-to-exceptional drought (D1-D4).
- Snowpack since April 1 has rapidly decreased earlier than normal to near zero, with run-off going into parched soils. Reservoir levels are low throughout the region.
- Drought leads to concern for wildfire season. California has seen more fires and acres burned than this time last year.
- Drought impacts (e.g., pasture conditions, ecosystem health, water supply, recreation, fire potential) have intensified and expanded given back-to-back dry years. Drought preparedness is key.
The U.S. Drought Monitor (USDM) is updated each Thursday to show the location and intensity of drought across the country. Drought categories show experts’ assessments of conditions related to dryness and drought including observations of how much water is available in streams, lakes, and soils compared to usual for the same time of year.
California/Nevada conditions as of June 1, 2021:
- 100% of California is experiencing Moderate (D1) to Exceptional (D4) Drought (48% in D3, 26% in D4)
- California population in drought: 37,250,607
- 100% of Nevada is experiencing Moderate (D1) to Exceptional (D4) Drought (35% in D3, 41% in D4)
- Nevada population in drought: 2,700,554
U.S. Drought Monitor Categories
The U.S. Drought Monitor (USDM) is updated each Thursday to show the location and intensity of drought across the country. Drought categories show experts’ assessments of conditions related to dryness and drought including observations of how much water is available in streams, lakes, and soils compared to usual for the same time of year.
California/Nevada conditions as of June 1, 2021:
- 100% of California is experiencing Moderate (D1) to Exceptional (D4) Drought (48% in D3, 26% in D4)
- California population in drought: 37,250,607
- 100% of Nevada is experiencing Moderate (D1) to Exceptional (D4) Drought (35% in D3, 41% in D4)
- Nevada population in drought: 2,700,554
Current Conditions
- According to the U.S. Drought Monitor, over the last 4 weeks drought conditions degraded in parts of central and coastal California, including the Sacramento Valley. Both California and Nevada are now 100% in drought. Nearly 50% of the region has seen a 3-5 drought class degradation over the last year.
- Since October 2019, much of California and Nevada are missing 1+ years worth of precipitation, and California has 1.5+ years of missing flow.
- The snowpack in the Sierra is nearly gone, with snowmelt occurring much earlier than normal (averaged over 2000-2015) and reservoir levels in the 28 Western Sierra reservoirs are about 75% of normal. Snowpack that feeds Lake Tahoe has mostly melted, and lake levels are about two-thirds of normal (averaged over 1981-2010) for this time of year. Most of the 10 largest reservoirs in Northern California are at or below the lowest 10th percentile levels for this time of year, with Lake Oroville near a record low.
- Flows remain below to extremely below normal, and high soil moisture deficits have reduced runoff efficiencies. For more detail, visit the California and Nevada Natural Resources Conservation Service (NRCS) Water Supply Outlooks.
- The current 2019-2021 drought is similar in precipitation deficit to 2012-2014 and 2013-2015, and it is a degree cooler on average than the 2013-2015 time period.
- Evaporative demand (the atmospheric thirst that drives evapotranspiration) remains high as it has been throughout this water year, and vegetation is showing stress.
- The current drought conditions have led to concern for the wildfire season. According to CAL FIRE, there have been more fires and acres burned in California in 2021 so far than last year to date. More wildland fire information can be found in a webinar summary of the May 24th Drought Update and Wildland Fire Outlook for California and the Southwest.
How is drought affecting your neighborhood?
Click to see drought indicators, outlooks, and historical conditions by city, county, and state, and to sign up for U.S. Drought Monitor alert emails.
U.S. Drought Monitor 1-Year Change Map

Percent of Normal Precipitation: Last 30 Days and Water Year to Date


Precipitation Anomaly Since October 2019

Water Storage + Snowpack for the Western Sierra and Lake Tahoe


Oroville Reservoir Water Storage

Comparison of Past California Temperature and Precipitation Deficits

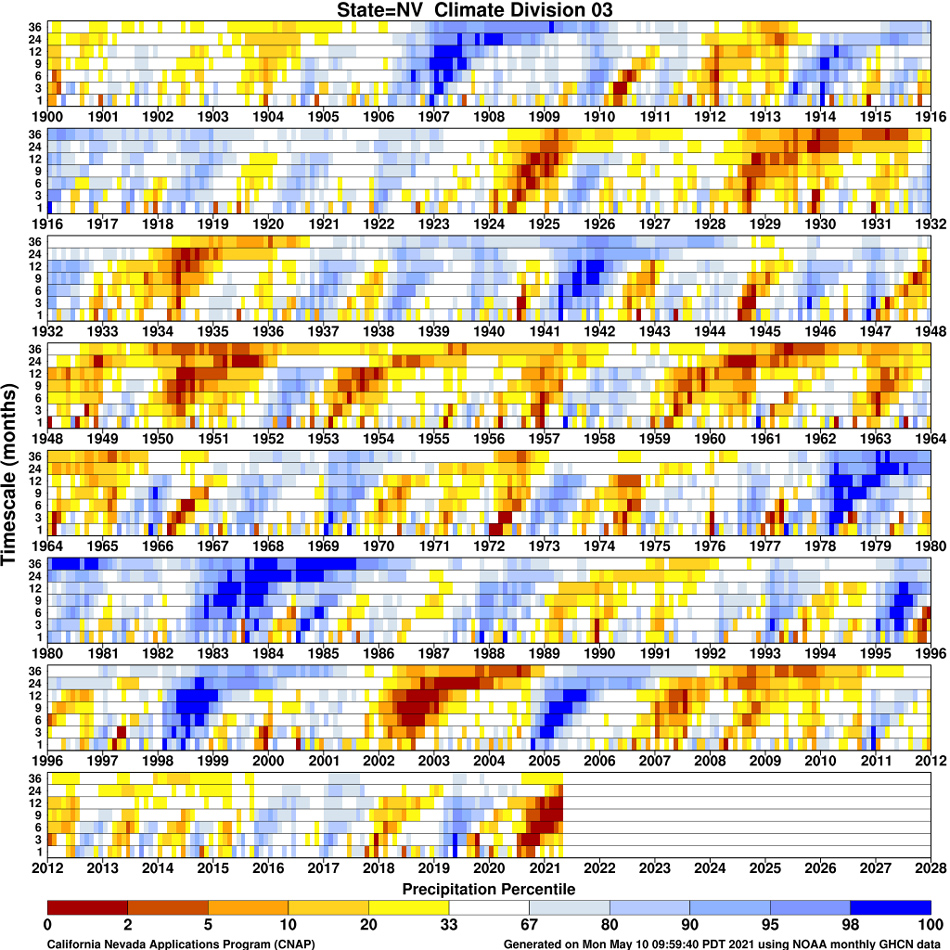
Precipitation Percentiles for Central Nevada: 1900-Present
1-Month Evaporative Demand Drought Index (EDDI)

Recent Drought Impacts
- Current conditions continue to intensify and expand drought impacts as the region heads into summer.
- Over the past month, Condition Monitoring Observer Reports (CMOR) highlight less water for irrigation, reduced yields, poor pasture forage, supplemental feeding, reduced grazing on public lands, animal stress, dry stock ponds, water hauling, culling and selling cattle, new well drilling, more invasive species, and water conservation.
- On May 26, the State Water Resources Control Board notified 930 junior water rights holders in the Upper Russian River basin that there is not enough water in the system and that diversions must be reduced immediately.
- On May 17, the California Department of Water Resources filed an application for water quality certification with the State Water Resources Control Board for the 2021 Emergency Drought Salinity Barrier Project.
- On May 12, extreme drought conditions forced closure of Klamath Project’s “A” Canal.
- On May 10, California Governor Newsom expanded the Drought Emergency to Klamath River, Sacramento-San Joaquin Delta, and Tulare Lake Watershed Counties and announced a $5.1 billion package for water infrastructure and drought response. 41 counties are now under a drought state of emergency to protect communities and the environment, representing 30% of the state’s population. This follows an April 10 emergency proclamation directing state agencies to take immediate action to bolster drought resilience across the state and declaring a state of emergency in Mendocino and Sonoma counties due to severe drought conditions in the Russian River Watershed.
- On May 5, the U.S. Bureau of Reclamation (USBR) placed a hold on North-of-Delta Agriculture Service Contractors due to worsening drought conditions. On May 26, USBR reduced M&I water service contractors allocations from 55% to 25% of historic use and confirmed the May 5 0%.
- The California Department of Fish and Wildlife is taking the proactive measure of trucking millions of hatchery-raised juvenile Central Valley fall-run chinook salmon this spring to San Pablo Bay, San Francisco Bay, and seaside net pens due to projected poor river conditions in the Central Valley.
- California has already experienced a significant increase in the number of wildfires and acres burned compared to last year.
California Wildfire Statistics: 2020 vs. 2021 Year-to-Date

- Many counties or districts have declared local drought emergencies across the northern and central part of California and parts of Nevada, including Truckee Meadows Water Authority, which declared level 2 drought (which means required water conservation measures this summer). Media outlets are reporting impacts such as:
- 30% reduction in water deliveries to Truckee Carson Irrigation District farmers. Douglas County commissioners in Nevada have adopted a resolution declaring drought conditions and are encouraging water conservation.
- All 5 of Napa County’s cities are promoting water conservation going into this summer, and both wine production and tourism worries grow.
- Wells are starting to dry up in Fresno County. Some portions of Kings River are reportedly dry.
- South Lake Tahoe boat ramp closed due to low water levels. Dozens of houseboats are being pulled out of Lake Oroville due to falling water levels.
- Farmers are choosing not to plant and pulling out of farmers markets and produce-box subscriptions. Some Central Valley farmers are destroying crops to save water for other crops.
- Water districts struggling with limited or no supplies are looking to their counterparts in other districts to negotiate water transfers to add whatever flexibility they can.
- According to the recent California National Agricultural Statistics Service reports, many crops are being impacted, such as reduced rice acreage, and some growers have removed almond trees due to the lack of available water.
Drought and Climate Outlook
El Niño–Southern Oscillation (ENSO)
NOAA’s ENSO alert system status is currently a final La Niña advisory—La Niña has ended—with ENSO-neutral likely to continue through the Northern Hemisphere summer (67% chance in June-August 2021). For more information, please check out the NOAA ENSO blog, including a discussion on potential back-to-back La Niña years.
Seasonal Drought, Temperature, and Precipitation Outlooks
With the close of the primary wet season in California-Nevada, drought is expected to persist in the near term and through summer. The National Weather Service Climate Prediction Center forecasts through August have increased odds of above-normal temperatures with the highest odds centered on Nevada in June and on the Four Corners areas over the summer. Most of the region has equal chances of above/normal/below precipitation, including those areas impacted by the summer monsoon.
Seasonal Drought Outlook: May 20 - August 31, 2021

Three-Month Temperature and Precipitation Outlooks

National Significant Wildland Fire Potential Outlook
According to the National Interagency Fire Center’s Predictive Services, fuels remain very dry across large swaths of the Southwest, Great Basin, and California, with fuel dryness in much of the West two to four weeks ahead of schedule. The Southwest is forecast to have above-normal significant fire potential through June before the Southwest Monsoon arrives. Above-normal significant fire potential will expand northward into the Great Basin through August and into the Sierra in June and July and continuing through September. Most mid- and upper-elevation areas are expected to have above-normal significant fire potential from June through September, except for some coastal and far eastern areas. Lower elevations in California remain at normal through August because strong downslope wind patterns are unusual during summer months and fuel loading is light.
June - July Significant Wildland Fire Potential Outlook


Drought Early Warning Resources
California Nevada California-Nevada DEWS
Prepared By
Amanda Sheffield
NOAA/NIDIS California-Nevada DEWS Regional Drought Information Coordinator
Email: amanda.sheffield@noaa.gov
Julie Kalansky
Program Manager, California-Nevada Applications Program (NOAA RISA team)
Email: jkalansky@ucsd.edu
This drought status update is issued in partnership between the National Oceanic and Atmospheric Administration (NOAA), the California-Nevada Applications Program, a NOAA RISA team, and the Western Regional Climate Center at the Desert Research Institute to communicate the current state of drought conditions in California-Nevada based on recent conditions and the upcoming forecast. NIDIS and its partners will issue future drought updates as conditions evolve.