Drought Expands Across the Midwest and Is Likely to Persist In Many Areas Through the Fall Season
Key Points
- In early June, the entire Midwest region was drought-free. However, severely dry conditions and typical summer heat led to the return of drought, particularly across portions of the Ohio River Basin. According to the September 17 U.S. Drought Monitor, 33.3% of the Midwest region is in drought (D1-D4), with an additional 43.8% Abnormally Dry (D0).
- In Ohio, 30% of the state is experiencing Extreme to Exceptional Drought (D3–D4), with Exceptional Drought present since late August. This is the first time Ohio has experienced Exceptional Drought since the U.S. Drought Monitor began in 2000.
- Drought impacts are extensive across Ohio, especially southern and southeastern sections of the state, including negative impacts to livestock production (selling herds, lack of forage, hauling water), crop production (reduction in yields for row and specialty crops), and municipal water supply, as well as extensive landscape impacts and elevated wildfire activity and risk.
- Streamflows are extremely low across eastern portions of the Midwest. Much-below-normal streamflow on the Ohio River is contributing to low water on the Lower Mississippi River. The U.S. Army Corps of Engineers are operating 4 dredges in the Lower Mississippi to maintain the 9-foot navigation channel and began constructing an underwater sill in Louisiana in mid-September to prevent upriver progression of saltwater from the Gulf of Mexico.
- Below-normal flows are expected to persist in the Ohio Basin until at least late October or November, which means water levels are expected to continue to decrease on the Lower Mississippi River.
- October 2024 outlooks and the seasonal outlook for September 19-December 31, 2024 favor conditions that are suitable for drought to persist across portions of Ohio, Kentucky, Indiana, Illinois, and Missouri through the end of December. Drought improvement or removal is predicted across northern portions of Ohio, Indiana, and Illinois, as well as Wisconsin and Michigan by the end of the year.
- Persistent drought will continue to stress agricultural and livestock production, amplify issues with municipal water supply, and increase fire risk this fall. Also, dry conditions in the fall and early winter will limit soil moisture recharge that usually happens this time of year.
The U.S. Drought Monitor depicts the location and intensity of drought across the country. The map uses 5 classifications: Abnormally Dry (D0), showing areas that may be going into or are coming out of drought, and four levels of drought (D1–D4).
This maps shows conditions for the Midwest Drought Early Warning System (DEWS), which includes Minnesota, Iowa, Missouri, Wisconsin, Illinois, Indiana, Michigan, Kentucky, and Ohio.
The U.S. Drought Monitor is a joint effort of the National Oceanic and Atmospheric Administration, U.S. Department of Agriculture, and National Drought Mitigation Center.
A drought index combines multiple drought indicators (e.g., precipitation, temperature, soil moisture) to depict drought conditions. For some products, like the U.S. Drought Monitor, authors combine their analysis of drought indicators with input from local observers. Other drought indices, like the Standardized Precipitation Index (SPI), use an objective calculation to describe the severity, location, timing, and/or duration of drought.
Learn MorePeriods of drought can lead to inadequate water supply, threatening the health, safety, and welfare of communities. Streamflow, groundwater, reservoir, and snowpack data are key to monitoring and forecasting water supply.
Learn MoreDrought can reduce the water availability and water quality necessary for productive farms, ranches, and grazing lands, resulting in significant negative direct and indirect economic impacts to the agricultural sector. Monitoring agricultural drought typically focuses on examining levels of precipitation, evaporative demand, soil moisture, and surface/groundwater quantity and quality.
Learn MoreU.S. Drought Monitor Categories
D0 - Abnormally Dry
Abnormally Dry (D0) indicates a region that is going into or coming out of drought. View typical impacts by state.
D1 - Moderate Drought
Moderate Drought (D1) is the first of four drought categories (D1–D4), according to the U.S. Drought Monitor. View typical impacts by state.
D2 - Severe Drought
Severe Drought (D2) is the second of four drought categories (D1–D4), according to the U.S. Drought Monitor. View typical impacts by state.
D3 - Extreme Drought
Extreme Drought (D3) is the third of four drought categories (D1–D4), according to the U.S. Drought Monitor. View typical impacts by state.
D4 - Exceptional Drought
Exceptional Drought (D4) is the most intense drought category, according to the U.S. Drought Monitor. View typical impacts by state.
Total Area in Drought (D1–D4)
Percent area of the Midwest that is currently in drought (D1–D4), according to the U.S. Drought Monitor.
The U.S. Drought Monitor depicts the location and intensity of drought across the country. The map uses 5 classifications: Abnormally Dry (D0), showing areas that may be going into or are coming out of drought, and four levels of drought (D1–D4).
This maps shows conditions for the Midwest Drought Early Warning System (DEWS), which includes Minnesota, Iowa, Missouri, Wisconsin, Illinois, Indiana, Michigan, Kentucky, and Ohio.
The U.S. Drought Monitor is a joint effort of the National Oceanic and Atmospheric Administration, U.S. Department of Agriculture, and National Drought Mitigation Center.
The U.S. Drought Monitor is released every Thursday morning, with data valid through the previous Tuesday at 7 a.m. ET.
A drought index combines multiple drought indicators (e.g., precipitation, temperature, soil moisture) to depict drought conditions. For some products, like the U.S. Drought Monitor, authors combine their analysis of drought indicators with input from local observers. Other drought indices, like the Standardized Precipitation Index (SPI), use an objective calculation to describe the severity, location, timing, and/or duration of drought.
Learn MorePeriods of drought can lead to inadequate water supply, threatening the health, safety, and welfare of communities. Streamflow, groundwater, reservoir, and snowpack data are key to monitoring and forecasting water supply.
Learn MoreDrought can reduce the water availability and water quality necessary for productive farms, ranches, and grazing lands, resulting in significant negative direct and indirect economic impacts to the agricultural sector. Monitoring agricultural drought typically focuses on examining levels of precipitation, evaporative demand, soil moisture, and surface/groundwater quantity and quality.
Learn MoreCurrent Conditions for the Midwest
This update is based on data available as of Thursday, September 19, 2024 at 10:00 a.m. CT. We acknowledge that conditions are evolving.
- According to the U.S. Drought Monitor, 33.3% of the Midwest region is in drought (D1-D4).
- In early June, the entire Midwest region was drought-free. However, severely dry conditions and typical summer heat led to the return of drought, particularly across portions of the Ohio River Basin (Figure 1).
- In Ohio, 30% of the state is experiencing Extreme and Exceptional Drought (D3–D4), with Exceptional Drought present since late August. This is the first time the state has experienced Exceptional Drought since the U.S. Drought Monitor began in 2000.
- Below-normal precipitation over the last 60 days led to the expansion of Moderate to Severe Drought (D1-D2) across other portions of the Midwest, including western Kentucky, southern Illinois, Indiana, and Missouri, and Abnormally Dry (D0) conditions across an additional 43.8% of the region (Figure 2).
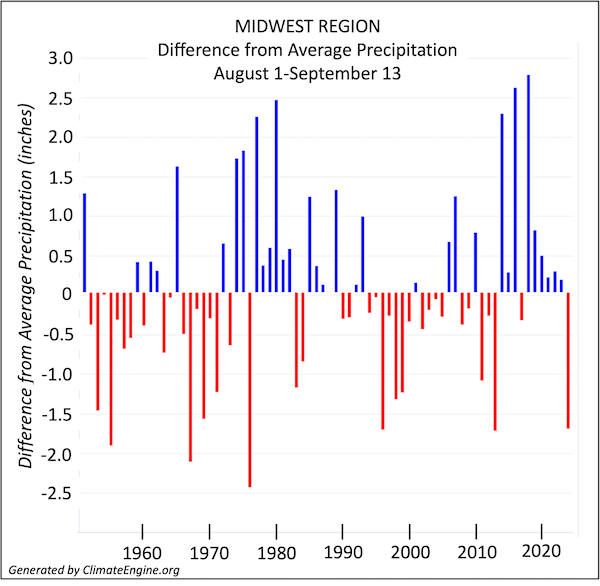
- Precipitation from August 1–September 13, when averaged across the Midwest region, was about 1.5 inches below normal. This is the driest August 1–September 13 time frame in the region since 2012, and ranks 6th driest since 1951 (Figure 3).
Figure 1: 9-Week U.S. Drought Monitor Change Map (Since July 16, 2024)
Key Takeaway: Drought worsened by one to four categories on the U.S. Drought Monitor across portions of all Midwestern states.
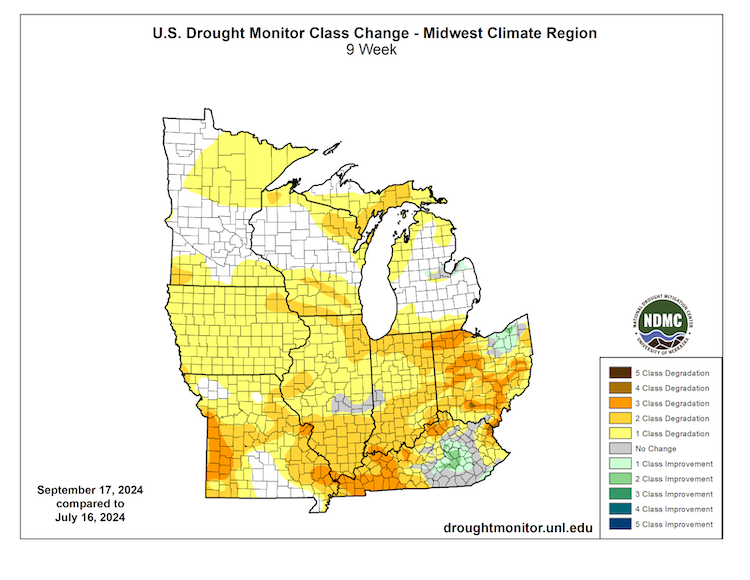
Figure 2: 60-Day Accumulated Precipitation – Percent of Normal (July 19–September 17, 2024)
Key Takeaway: Key Takeaway. Precipitation was only 25-75% of normal across the majority of the Midwest region over the last 60 days, resulting in drought expansion across many areas.
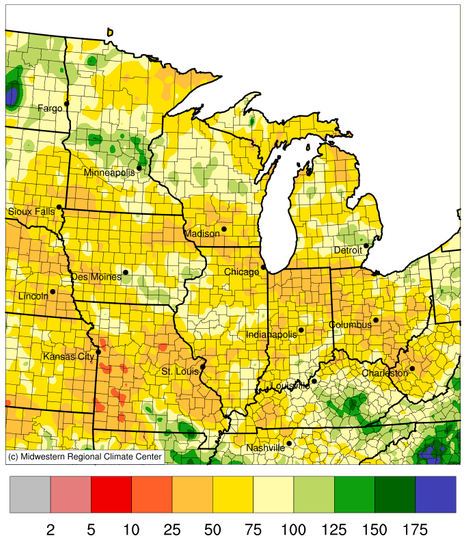
Figure 3: Difference from Average Precipitation for the Midwest Region (for August 1–September 13)
Key Takeaway: From August 1–September 13, 2024, precipitation was about 1.5 inches below normal when averaged across the Midwest region. This is the driest August 1–September 13 time frame in the region since 2012, and ranks 6th driest since 1951.
Midwest Drought Impacts
- The dry conditions have led to very low streamflow (Figure 4) across eastern portions of the Midwest. According to the U.S. Geological Survey, the Hocking River in Ohio recorded its lowest level since 1930 in early September.
- Flows on the Ohio River are significantly below normal. Since the Ohio River is the largest contributor to flow on the mainstem of the Mississippi (about 50-60% of the flow), water levels on the Lower Mississippi River are below normal and exceeded low-water thresholds in August. In response, the U.S. Army Corps of Engineers is operating 4 dredges to maintain the 9-foot navigation channel and began constructing an underwater sill in mid-September to prevent upriver progression of saltwater from the Gulf of Mexico. Also, the U.S. Coast Guard issued restrictions to tows on the Mississippi River, which limits how much product tows can carry.
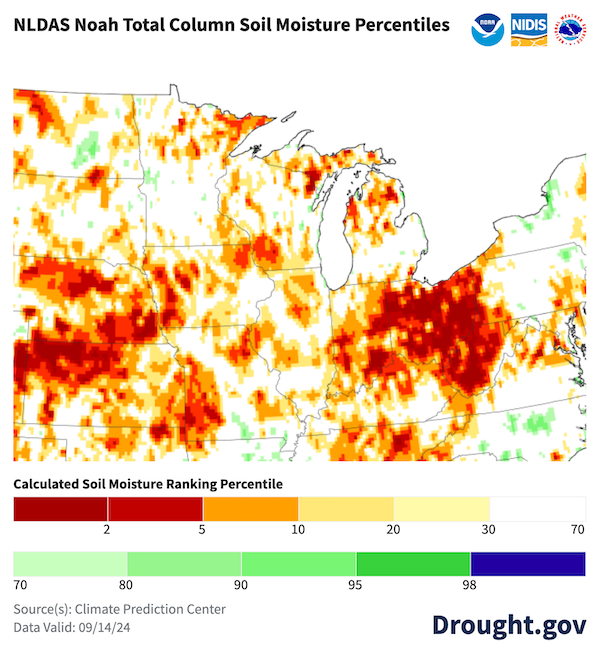
- The lack of rainfall led to below-normal soil moisture percentiles across many parts of the region, particularly across Ohio and Indiana (Figure 5).
- Drought impacts are significant across areas in Ohio in Extreme to Exceptional Drought (D3-D4) including negative impacts to livestock production (selling herds, lack of forage, hauling water), crop production (corn, soybean, and some specialty crop yields will be reduced), elevated wildland fire activity and risk to forested areas in southeast Ohio, impacts to municipal water supply (some cities are using reserve sources or issuing mandatory or voluntary water restrictions), and extensive landscape impacts (dying trees/perennials, early fall color, dying lawns).
- Kentucky, Illinois, Indiana, and Missouri also report drought impacts. These impacts range from low or dry ponds and creeks, drought-stressed crops (although overall impact is minimal), poor pasture health, cracked soils, elevated risk for wildland fire (which is prompting burn bans in many counties), and early dormant lawns.
Report your local drought impacts through a Condition Monitoring Observer Report:
Figure 4: 28-Day Average Streamflow Conditions (Valid September 19, 2024)
Key Takeaway: Average streamflow over the last 28 days was below normal across many states in the Midwest, primarily in Ohio, Indiana, Illinois, Kentucky, and Missouri.
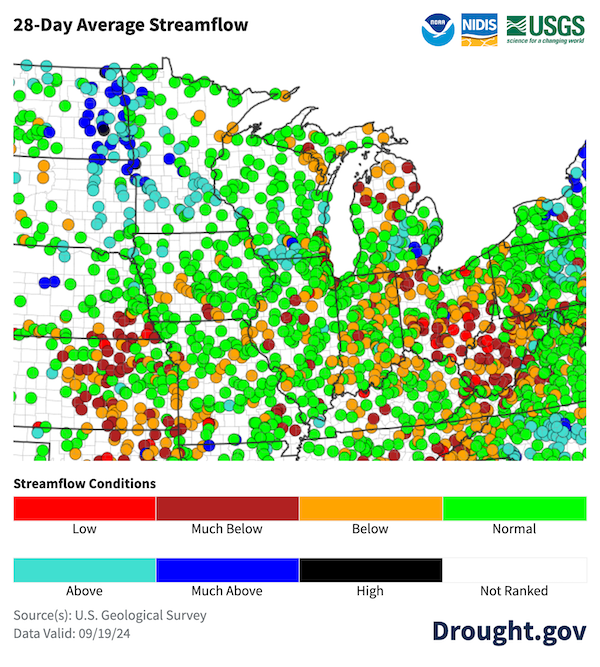
Figure 5: Total Column Depth Soil Moisture Percentiles (as of September 14, 2024)
Key Takeaway: The lack of rainfall led to below-normal soil moisture percentiles across many parts of the region, particularly across Ohio and Indiana.
Outlooks and Potential Impacts
- The 8-14 day outlook for September 24–30 shows dry and unseasonably warm temperatures are likely to persist across much of the Midwest, which means drought conditions are likely to persist or worsen through the end of September (Figure 6). One positive of the dry conditions this time of year is conditions are more suitable for harvest season.
- The monthly precipitation outlook for October 2024 shows increased chances for below-normal precipitation across Missouri and portions of Iowa, Illinois, Indiana, and Kentucky. The rest of the region has equal chances for above-, below-, or near-normal precipitation (Figure 7). For areas that receive below-normal precipitation over the next month, drought is likely to persist, or could worsen, during this time.
- For streamflow, below-normal flows are expected to persist in the Ohio Basin until at least late October. Therefore, water levels on the Lower Mississippi River are expected to continue to decrease, which could potentially increase the need for further dredging to avoid navigational impacts.
- The seasonal drought outlook for September 19–December 31, 2024 shows that drought is likely to persist across portions of Ohio, Kentucky, Indiana, Illinois and Missouri (Figure 8). However, drought improvement or removal is predicted across portions of northern Ohio, Indiana, Illinois, as well as Wisconsin and Michigan by the end of the year. One uncertainty in the fall season forecast is the occurrence of tropical activity, and whether or not tropical storm remnants will bring rainfall relief to the Midwest.
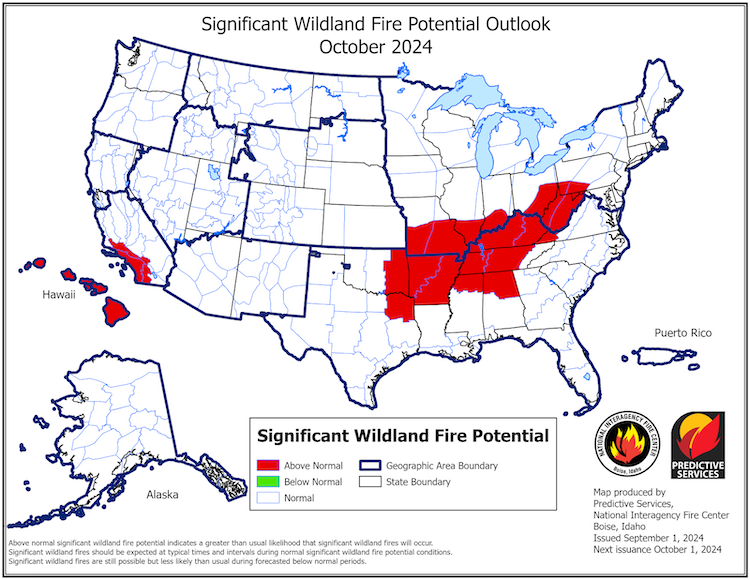
- Persistent drought will continue to stress agricultural and livestock production, amplify issues with municipal water supply, and increase fire risk this fall (Figure 9). Also, dry conditions in the fall and early winter will limit soil moisture recharge that usually happens this time of year.
Figure 6: 8–14 Day Temperature and Precipitation Outlooks (September 26–October 2, 2024)
Key Takeaway: Above-normal temperatures are very likely across the Midwest region from September 26–October 2. Below-normal precipitation is also likely across northwest portions of the region, with the chance for above-normal precipitation over Kentucky.
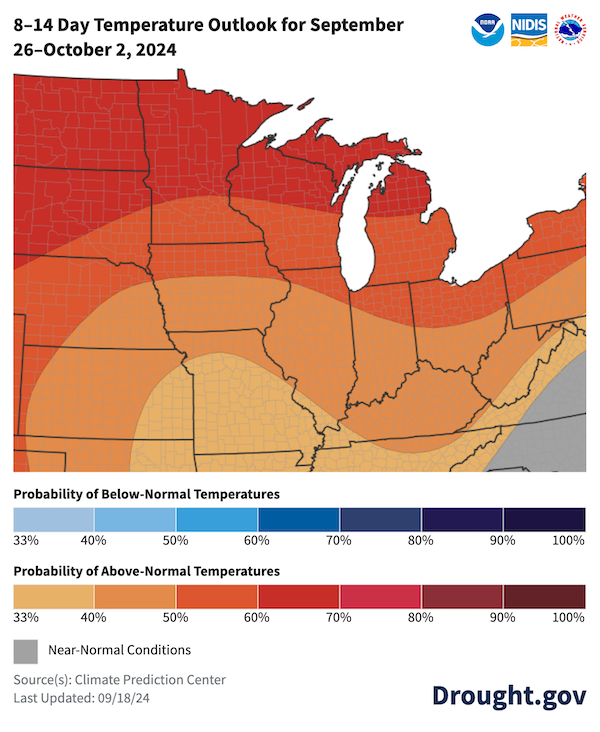
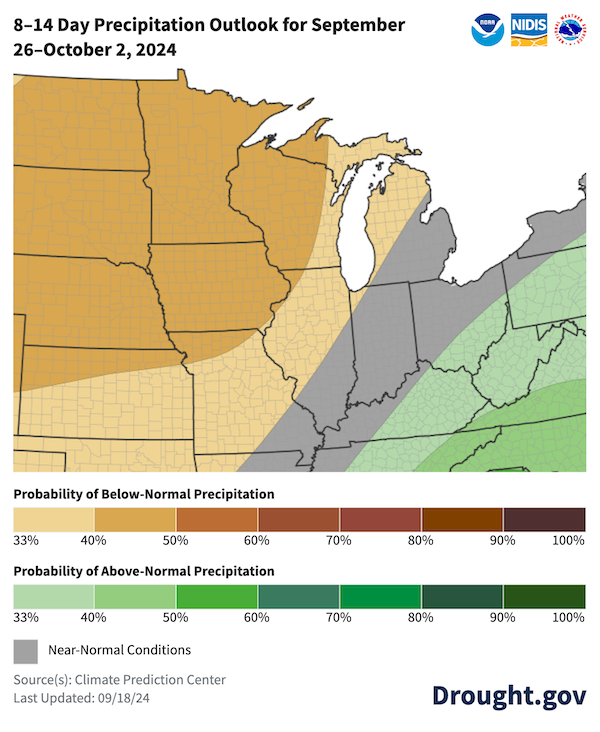
Figure 7: October 2024 Precipitation Outlook
Key Takeaway: There are slightly increased chances for below-normal precipitation across Missouri and portions of Iowa, Illinois, Indiana, and Kentucky. The rest of the region has equal chances for above-, below-, or near-normal precipitation during October 2024.
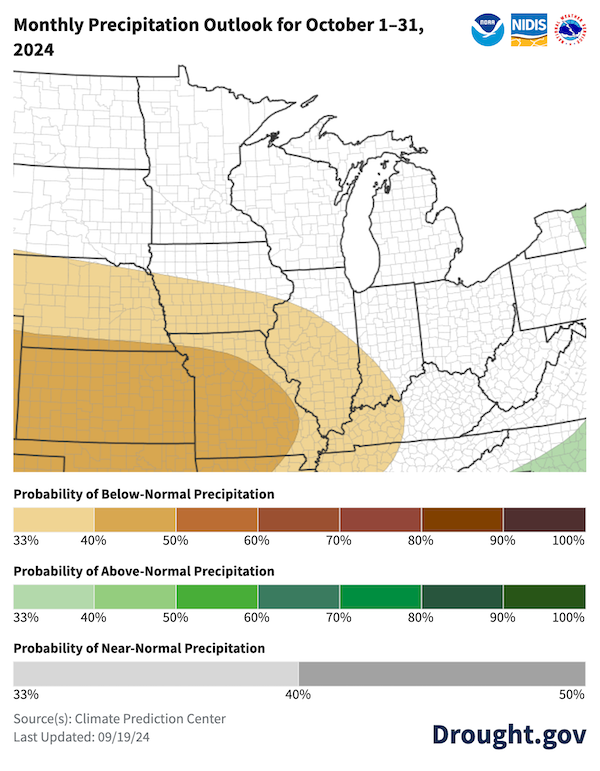
Figure 8: Seasonal Drought Outlook for September 19–December 31, 2024
Key Takeaway: Drought is likely to persist across portions of Ohio, Kentucky, Indiana, Illinois and Missouri through December 31, 2024. However, drought improvement or removal is predicted across northern portions of Ohio, Indiana, and Illinois, as well as Wisconsin and Michigan.
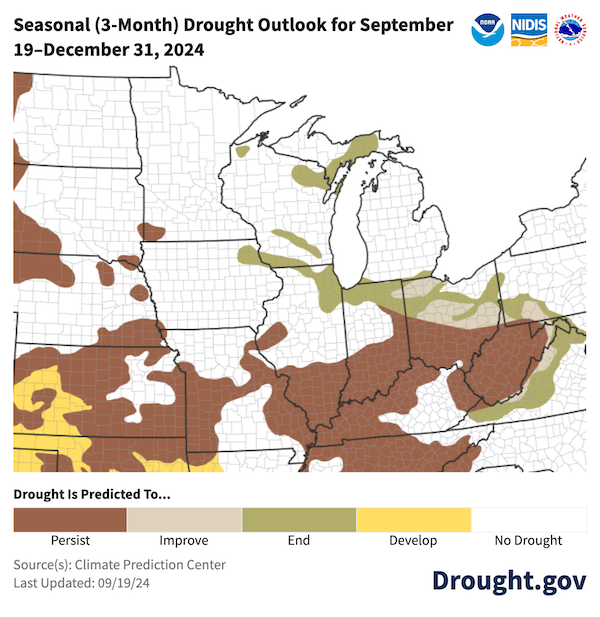
Figure 9: Significant Wildland Fire Potential Outlook for October 2024
Key Takeaway: Kentucky, as well as southern portions of Ohio, Missouri, Illinois, and Indiana, have above-normal potential for significant wildland fire in October.
Resources
- For more information on the drought conditions in Ohio, register for the Special Drought Webinar for West Virginia and Ohio taking place on Friday, September 17 from 10 a.m.-12 p.m. CT.
- More local information is available from the following resources:
- To report or view local drought impact information:
Register for the North Central U.S. Climate and Drought Summary & Outlook Webinar on Thursday, October 17 at 1 p.m. CT, which will provide updated information about conditions, impacts, and outlooks.
Prepared By
Molly Woloszyn
Cooperative Institute for Research in Environmental Sciences (CIRES), University of Colorado Boulder / NOAA National Integrated Drought Information System (NIDIS)
Doug Kluck
NOAA National Centers for Environmental Information
Dennis Todey & Laurle Nowatske
U.S. Department of Agriculture Midwest Climate Hub
Audra Bruschi
NOAA National Weather Service Central Region
Jim Noel & Mike Welvaert
NOAA National Weather Service Ohio and North Central River Forecast Center
Anna Wolverton
U.S. Army Corps of Engineers Mississippi Valley Division / NOAA National Weather Service
Melissa Widhalm
Midwestern Regional Climate Center / Purdue University
Denise Gutzmer
National Drought Mitigation Center
Trent Ford
University of Illinois / Illinois State Climate Office
Aaron Wilson
Ohio State University / State Climate Office of Ohio
A special thank you to the state climate offices and National Weather Service offices in the Midwest region for providing local information on drought conditions and impacts included in the webinar and in this Drought Status Update.
This Drought Status Update is issued in partnership between the National Oceanic and Atmospheric Administration (NOAA), U.S. Department of Agriculture (USDA), U.S. Army Corps of Engineers (USACE), and the National Drought Mitigation Center to communicate a potential area of concern for drought expansion and/or development within the Midwest region based on recent conditions and the upcoming forecast. NIDIS and its partners will issue future Drought Status Updates as conditions evolve.