Drought Expands Across the Midwest Over the Last Month with Impacts Increasing.
Drought Is Expected to Persist Through Winter Across Portions of the Region.
Key Points
- According to the U.S. Drought Monitor, 53% of the Midwest region is in drought (D1–D4), which is 11% more than last week and 20% more than four weeks ago. Drought is most intense in Ohio, where 64% of the state is in Moderate to Exceptional Drought (D1–D4).
- Drought conditions worsened over the last four weeks across portions of Missouri, Minnesota, Michigan, Iowa, Wisconsin, and northern portions of Illinois and Indiana.
- Drought impacts include below-normal soil moisture, reduced streamflow causing navigational and ecological issues, low lake levels and stock ponds, poor pasture conditions, and dry and windy conditions, which have supported an increase in wildland fires.
- For the third year in a row, low water levels on the Mississippi River are causing navigational issues and enabling the intrusion of saltwater up the river, which can affect municipal and industrial water intakes. To mitigate these problems, barges currently have draft restrictions that limit the amount of cargo they can carry, the U.S. Army Corps of Engineers (USACE) is actively dredging to maintain a 9-foot navigation channel, and an underwater sill was constructed to prevent saltwater intrusion. Flows on the Lower Mississippi will likely remain low until late fall/early winter.
- November 2024 will likely bring above-normal temperatures to the region and equal chances for above-, near-, or below-normal precipitation.
- NOAA’s Winter Outlook for December 2024–February 2025 calls for wetter-than-normal conditions across the Great Lakes region, which could help improve drought conditions across portions of Ohio, Indiana, and Michigan. However, drought is expected to persist through January 2025 for areas across Minnesota, Iowa, Missouri, northern Illinois, and Wisconsin.
The U.S. Drought Monitor depicts the location and intensity of drought across the country. The map uses 5 classifications: Abnormally Dry (D0), showing areas that may be going into or are coming out of drought, and four levels of drought (D1–D4).
This maps shows conditions for the Midwest Drought Early Warning System (DEWS), which includes Minnesota, Iowa, Missouri, Wisconsin, Illinois, Indiana, Michigan, Kentucky, and Ohio.
The U.S. Drought Monitor is a joint effort of the National Oceanic and Atmospheric Administration, U.S. Department of Agriculture, and National Drought Mitigation Center.
A drought index combines multiple drought indicators (e.g., precipitation, temperature, soil moisture) to depict drought conditions. For some products, like the U.S. Drought Monitor, authors combine their analysis of drought indicators with input from local observers. Other drought indices, like the Standardized Precipitation Index (SPI), use an objective calculation to describe the severity, location, timing, and/or duration of drought.
Learn MorePeriods of drought can lead to inadequate water supply, threatening the health, safety, and welfare of communities. Streamflow, groundwater, reservoir, and snowpack data are key to monitoring and forecasting water supply.
Learn MoreDrought can reduce the water availability and water quality necessary for productive farms, ranches, and grazing lands, resulting in significant negative direct and indirect economic impacts to the agricultural sector. Monitoring agricultural drought typically focuses on examining levels of precipitation, evaporative demand, soil moisture, and surface/groundwater quantity and quality.
Learn MoreU.S. Drought Monitor Categories
D0 - Abnormally Dry
Abnormally Dry (D0) indicates a region that is going into or coming out of drought. View typical impacts by state.
D1 - Moderate Drought
Moderate Drought (D1) is the first of four drought categories (D1–D4), according to the U.S. Drought Monitor. View typical impacts by state.
D2 - Severe Drought
Severe Drought (D2) is the second of four drought categories (D1–D4), according to the U.S. Drought Monitor. View typical impacts by state.
D3 - Extreme Drought
Extreme Drought (D3) is the third of four drought categories (D1–D4), according to the U.S. Drought Monitor. View typical impacts by state.
D4 - Exceptional Drought
Exceptional Drought (D4) is the most intense drought category, according to the U.S. Drought Monitor. View typical impacts by state.
Total Area in Drought (D1–D4)
Percent area of the Midwest that is currently in drought (D1–D4), according to the U.S. Drought Monitor.
The U.S. Drought Monitor depicts the location and intensity of drought across the country. The map uses 5 classifications: Abnormally Dry (D0), showing areas that may be going into or are coming out of drought, and four levels of drought (D1–D4).
This maps shows conditions for the Midwest Drought Early Warning System (DEWS), which includes Minnesota, Iowa, Missouri, Wisconsin, Illinois, Indiana, Michigan, Kentucky, and Ohio.
The U.S. Drought Monitor is a joint effort of the National Oceanic and Atmospheric Administration, U.S. Department of Agriculture, and National Drought Mitigation Center.
The U.S. Drought Monitor is released every Thursday morning, with data valid through the previous Tuesday at 7 a.m. ET.
A drought index combines multiple drought indicators (e.g., precipitation, temperature, soil moisture) to depict drought conditions. For some products, like the U.S. Drought Monitor, authors combine their analysis of drought indicators with input from local observers. Other drought indices, like the Standardized Precipitation Index (SPI), use an objective calculation to describe the severity, location, timing, and/or duration of drought.
Learn MorePeriods of drought can lead to inadequate water supply, threatening the health, safety, and welfare of communities. Streamflow, groundwater, reservoir, and snowpack data are key to monitoring and forecasting water supply.
Learn MoreDrought can reduce the water availability and water quality necessary for productive farms, ranches, and grazing lands, resulting in significant negative direct and indirect economic impacts to the agricultural sector. Monitoring agricultural drought typically focuses on examining levels of precipitation, evaporative demand, soil moisture, and surface/groundwater quantity and quality.
Learn MoreCurrent Conditions for the Midwest
This update is based on data available as of Monday, October 21, 2024 at 4:00 p.m. CT. We acknowledge that conditions are evolving.
- According to the U.S. Drought Monitor, 53% of the Midwest region is in drought (D1–D4), which is 11% more than last week and 20% more than four weeks ago.
- Drought is most intense in Ohio, where 64% of the state is in Moderate to Exceptional Drought (D1–D4). The remnants of Hurricane Helene improved conditions in southeastern Ohio, but 8% of the state remains in Exceptional Drought (D4), which has been present since late August 2024.
- Over the last four weeks, drought conditions improved by one to three categories across portions of southeastern Ohio, Kentucky, southern Indiana, southern Illinois, and eastern Missouri. On the other hand, drought has expanded by one to two categories across southwestern Missouri and the Upper Midwest (Figure 1).
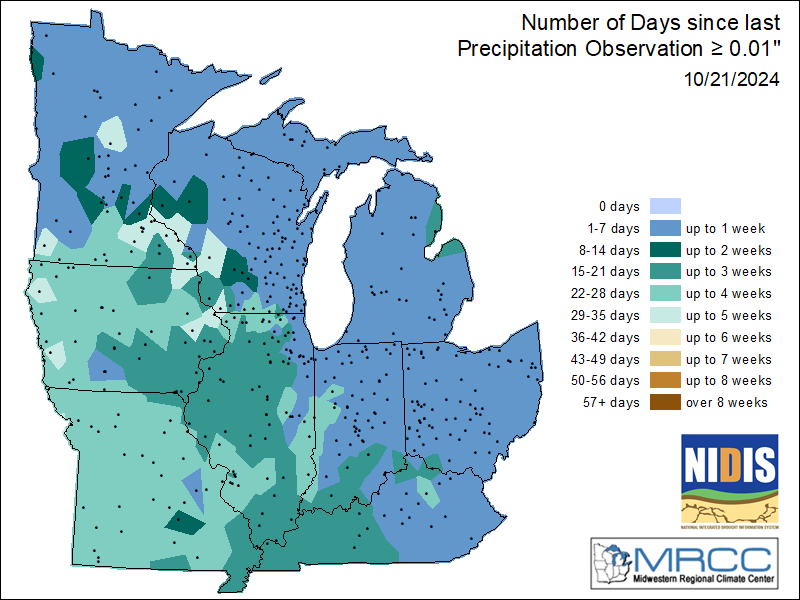
- The drought expansion in the Upper Midwest was driven by extremely below-normal precipitation, with only 2%–25% of normal across much of Minnesota and portions of Iowa (Figure 2). Portions of Minnesota, Iowa, and Missouri have had a significant stretch of days (up to 4–5 weeks) without measurable precipitation (greater than 0.01 inch) (Figure 3).
- Some locations in the Midwest set the record for their driest September. The Minneapolis–St. Paul Airport only received 0.06 inch of rainfall in September, breaking the previous record from 2012 of 0.24 inch (normal September rainfall is 3.02 inches). Minneapolis–St. Paul also recorded its warmest September on record, with a monthly average temperature of 70.4°F (previous record was 69.1°F in 2023).
Figure 1: 4-Week U.S. Drought Monitor Change Map (Since September 17, 2024)
Key Takeaway: Drought conditions have improved over the last four weeks by one to three categories on the U.S. Drought Monitor across portions of the Ohio River Basin, while areas in the Upper Midwest have seen conditions worsen by one to two categories.
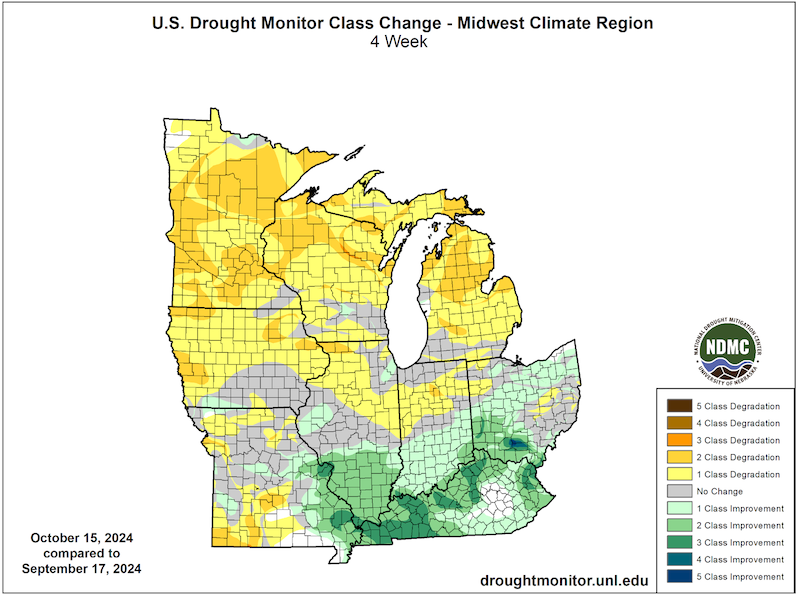
Figure 2: 30-Day Accumulated Precipitation – Percent of Normal (September 21–October 20, 2024)
Key Takeaway: Precipitation was only 0%–25% of normal across a majority of Minnesota and Iowa over the last 30 days. On the other hand, precipitation was 175%–300% of normal across portions of southeastern Ohio, Kentucky, and southern Illinois.
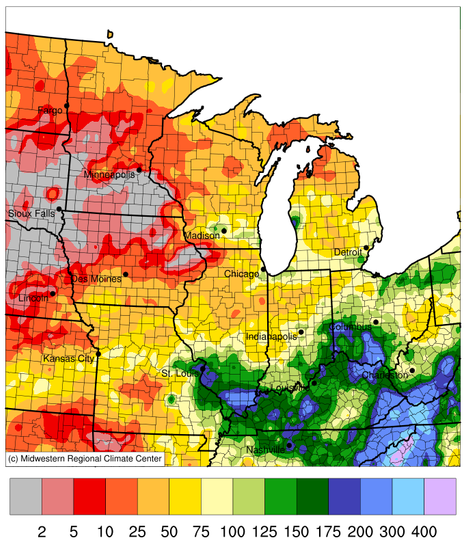
Figure 3: Number of Days Since Last Precipitation Observation Greater than 0.01 Inch
Key Takeaway: Portions of Minnesota, Iowa, and Missouri have had a significant stretch of days (up to 4–5 weeks) without measurable precipitation (greater than 0.01 inch).
Midwest Drought Impacts
- The lack of rainfall in many areas has led to extremely low soil moisture across much of the Midwest, including Iowa, Missouri, Minnesota, Illinois, Indiana, Michigan, and Ohio (Figure 4). The lack of soil moisture has stressed late-season crops and landscaping/vegetation, and created very dusty harvest conditions. In areas with low moisture and little to no rainfall, winter wheat and cover crops are not germinating, and some producers are delaying or avoiding planting.
- While some areas in Kentucky and Ohio received more rainfall over the last month, this rain came too late to salvage the damage to some crops. Producers in these areas are expecting significant impact to their soybean and corn yields due to the drought this summer.
- Drought conditions are impacting water availability in the Midwest, including driving below-normal streamflows (Figure 5), falling lake levels and water tables, and drying up stock ponds. In mid-October, part of the Illinois River closed to navigation because of low water levels and issues with boat groundings. The low streamflow is also impacting power plant cooling in northeastern Illinois and producing inadequate flows for ecosystems and sport fishing.
- Pasture conditions in Missouri, Ohio, Illinois, and Indiana are very poor, and many livestock producers have to feed supplemental hay and haul water. In Iowa, livestock water resources are becoming a concern.
- Low humidity, strong winds, and low soil moisture fueled fires and increased fire risk across areas of Minnesota, Iowa, Missouri, Illinois, Indiana, Wisconsin, and Michigan. As a result, many counties and states are issuing burn bans. In the fall, dry conditions have led to increased risk for rural on-farm fires. Fire can ignite in equipment like combines and tractors, which then spread through fields fueled by dry crops.
- Superior National Forest in Minnesota had to close a portion of the Boundary Waters Canoe Area due to a wildfire on October 8. Personnel and equipment for fire suppression is limited in the Midwest as resources are being used to respond to hurricanes and large fires in the West.
Report your local drought impacts through a Condition Monitoring Observer Report:
Figure 4: 0–100 cm Soil Moisture Percentiles (as of October 21, 2024)
Key Takeaway: The lack of rainfall in many areas has led to extremely low soil moisture across much of the Midwest, including Iowa, Missouri, Minnesota, Illinois, Indiana, Michigan, and Ohio.
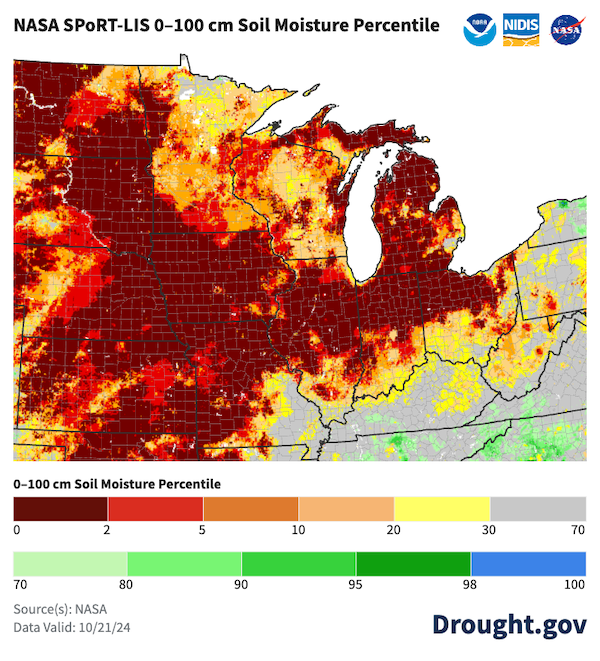
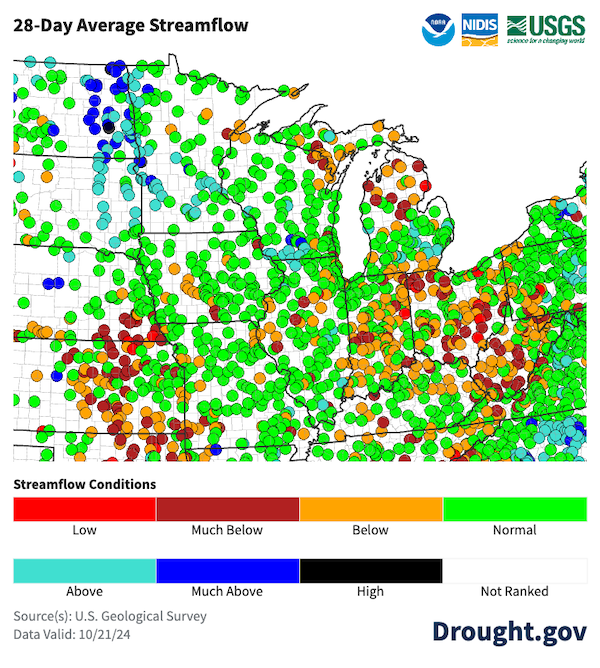
Figure 5: 28-Day Average Streamflow Conditions (Valid October 21, 2024)
Key Takeaway: Average streamflow over the last 28 days was below- to much below-normal across many areas, including Ohio, Indiana, northern Michigan, and portions of Illinois, Iowa, Minnesota, and Missouri.
Outlooks and Potential Impacts
- The Climate Prediction Center’s outlook for November 2024 shows an increased likelihood of above-normal temperatures across the entire Midwest region (Figure 6), with equal chances for above-, near-, or below-normal precipitation (Figure 7).
- For areas that receive near- to below-normal precipitation in November, drought is likely to persist where it is already an issue. Areas that are currently Abnormally Dry (D0) may see drought development without above-normal precipitation this coming month.
- NOAA just released its Winter Outlook for December 2024–February 2025 on October 17, which indicates that a slowly-developing, weaker La Niña is favored to influence conditions for the upcoming winter. A weaker La Niña implies that it would be less likely to result in conventional winter impacts.
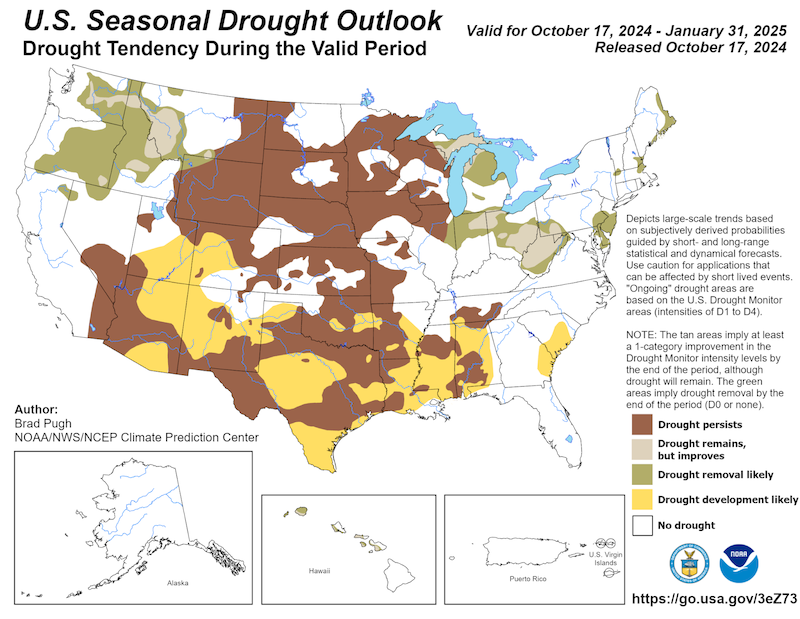
- In the Midwest, the Winter Outlook calls for increased chances for wetter-than-normal conditions across the Great Lakes region, which could help improve drought conditions across portions of Ohio, Indiana, and Michigan. Drought is expected to persist through January 2025 for areas in drought across Minnesota, Iowa, Missouri, northern Illinois, and Wisconsin (Figure 8).
Figure 6: November 2024 Temperature Outlook
Key Takeaway: The entire Midwest region has increased chances for above-normal temperatures in November, with highest probabilities across Missouri and southern Illinois.
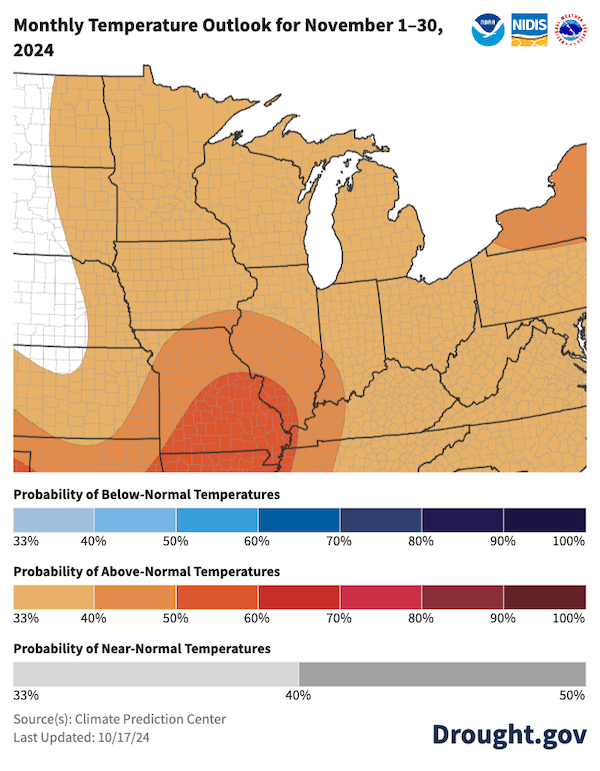
Figure 7: November 2024 Precipitation Outlook
Key Takeaway. There are equal chances for above-, near-, or below-normal precipitation across the Midwest in November.
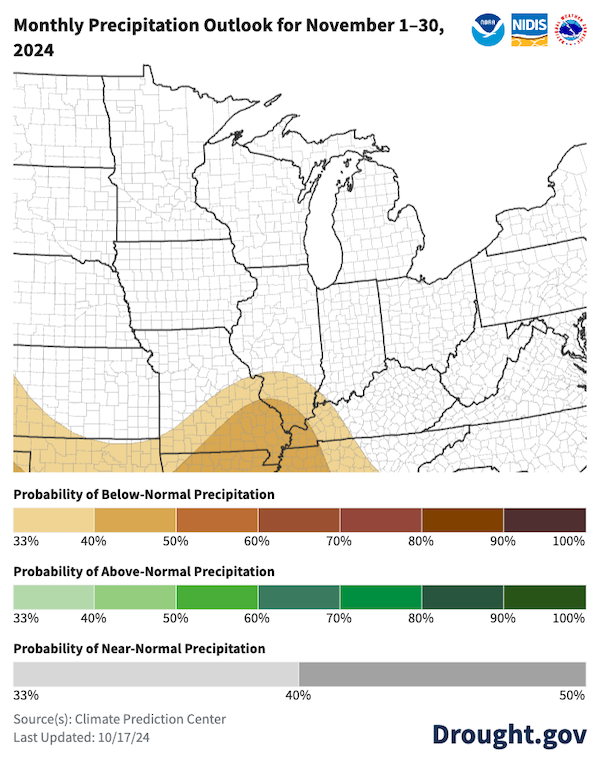
Figure 8: Seasonal Drought Outlook for October 17, 2024–January 31, 2025
Key Takeaway: Drought is expected to persist through January 2025 for areas in drought across Minnesota, Iowa, Missouri, northern Illinois, and Wisconsin. However, drought is likely to improve or be removed completely over the winter in Indiana, Ohio, and Michigan.
Mississippi River Update: Conditions and Outlook
- After a brief reprieve from the moisture from Hurricane Helene, portions of the Mississippi River are experiencing low water levels again. The gauge at Cairo, Illinois is fluctuating between 8 and 9 feet, where 9.0 feet is the low-water threshold for this station. Tower Rock is a rock formation and landmark island in the Mississippi River south of St. Louis, and it is now accessible by foot for the third year in a row.
- There are restrictions to navigation to mitigate low water level issues on the Lower Mississippi River. Currently, boats cannot draft deeper than 9.5 feet, which limits the amount of cargo they can carry, and cannot be loaded more than 6 barges wide. The USACE Is also operating 16 dredges on the Mississippi River to maintain a 9-foot navigation channel. Five dredges are proactively dredging to mitigate the falling river levels.
- Low water levels on the Lower Mississippi River since mid-August led to saltwater from the Gulf of Mexico intruding upstream, which can negatively affect local water supplies since many southern Louisiana communities rely upon fresh water from the Mississippi River. To mitigate these issues, the USACE built a saltwater sill in mid-September and continues to monitor the wedge. In 2023, USACE had to add additional height to the sill due to the prolonged dry conditions. This has not been needed yet this year, but may eventually be required in the future.
- The 28-day forecast shows the potential for significant low stages around 6.1-feet at Cairo with no additional rainfall in the short-term or extended outlook (record low is 4.5 feet, set in 2023). Other locations with forecasted near-record low water levels in the next 28 days include Memphis, Tennessee (-10.1 feet forecasted; record low is -12 feet), Arkansas City, Arkansas (-3.0 feet forecasted; record low is -5.1 feet), and Greenville, Mississippi (6.4 feet forecasted; record low is 4.1 feet).
- The fall season is a climatologically drier period for water levels on the Mississippi River, but this is the third year in a row that levels have been low enough to create significant impacts. Flows on the Lower Mississippi will likely remain low until late fall/early winter.
Resources
- More local information is available from the following resources:
- To report or view local drought impact information:
- Register for the North Central U.S. Climate and Drought Summary & Outlook Webinar on Thursday, November 21 at 1 p.m. CT, which will provide updated information about conditions, impacts, and outlooks.
Prepared By
Molly Woloszyn
Cooperative Institute for Research in Environmental Sciences (CIRES), University of Colorado Boulder / NOAA National Integrated Drought Information System (NIDIS)
Doug Kluck
NOAA National Centers for Environmental Information
Dennis Todey & Laurle Nowatske
U.S. Department of Agriculture Midwest Climate Hub
Jeff Boyne & Audra Bruschi
NOAA National Weather Service Central Region
Jim Noel, Mike Welvaert, & David Welch
NOAA National Weather Service Ohio and North Central River Forecast Center
Anna Wolverton
U.S. Army Corps of Engineers Mississippi Valley Division / NOAA National Weather Service
Austin Pearson
Midwestern Regional Climate Center / Purdue University
Denise Gutzmer
National Drought Mitigation Center
A special thank you to the state climate offices and National Weather Service offices in the Midwest region for providing local information on drought conditions and impacts included in the North Central webinar and in this Drought Status Update.
This Drought Status Update is issued in partnership between the National Oceanic and Atmospheric Administration (NOAA), U.S. Department of Agriculture (USDA), U.S. Army Corps of Engineers (USACE), and the National Drought Mitigation Center to communicate a potential area of concern for drought expansion and/or development within the Midwest region based on recent conditions and the upcoming forecast. NIDIS and its partners will issue future Drought Status Updates as conditions evolve.