Drought and Low Water Levels Likely to Worsen with Dry and Hot Forecast Persisting into September
Resources for Monitoring Drought & Heat Risk
Key Points
- According to the U.S. Drought Monitor, drought is currently impacting 40% of the Midwest region, primarily across the Upper Midwest and south into Iowa and Missouri (Figure 1).
- 78% of Wisconsin is experiencing drought, with a small portion of northern Wisconsin in the highest level of drought—exceptional drought (D4). This is the first time that D4 drought has impacted Wisconsin since the inception of the Drought Monitor in 2000.
- The region has been experiencing a significant heat wave over the last week, with persistent heat index values over 100°F. Many areas have been without rainfall as well (Figure 2), resulting in the persistence of drought conditions and worsening of drought conditions in Minnesota and Wisconsin (Figure 3).
- Negative drought impacts remain prevalent across Minnesota, Wisconsin, Iowa, and Missouri. Impacts include limited soil moisture for vegetation and potential crop yield reduction, poor pasture conditions forcing supplementary feeding for livestock, low surface water on streams and ponds/lakes, above-normal wildfire activity in Wisconsin, and the implementation of water conservation measures.
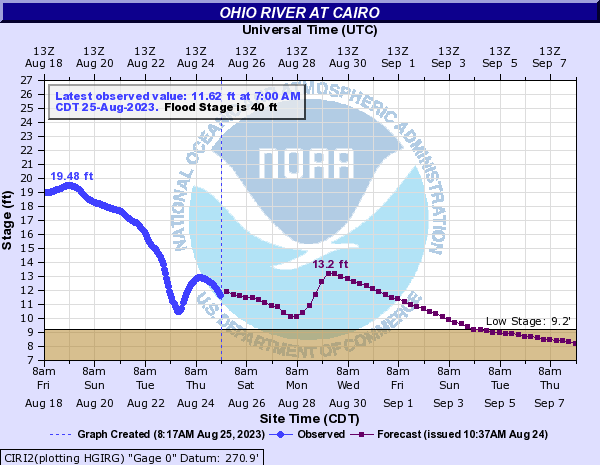
- The Upper Mississippi River levels remain very low, with a majority of the river below low flow thresholds. The Ohio River at Cairo, IL dropped almost ten feet since August 16 (Figure 4). Lower stages are expected to continue downstream to the Lower Mississippi River throughout the next week. Restrictions remain in place for navigation to reduce loads, and up to 17 dredges are operating along the entire length of the Mississippi River in order to maintain the 9-foot navigation channel.
- The forecasts and outlooks through early- to mid-September show the persistence of hot and dry weather will likely continue. Forecasts call for some rainfall over August 25–September 1 in portions of the Midwest, but widespread significant rainfall is limited (Figure 5).
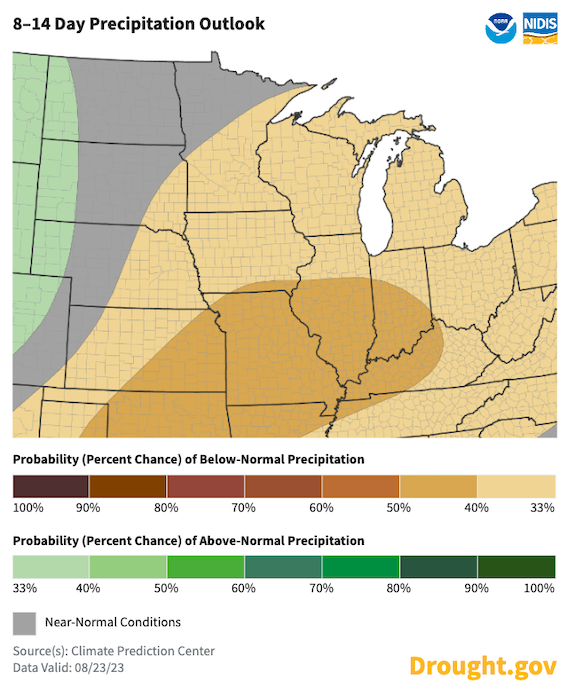
- There will be a brief reprieve from the heat towards the end of August, but the hot conditions are forecast to return in the August 31–September 6 time frame (Figure 6). Dry conditions are also likely to persist through early September (Figure 7).
- Potential impacts of the continued hot and dry conditions include the continuation of current impacts listed above, insufficient moisture for soybeans, which are in a critical growth stage right now, and increased fire risk.
- The Ohio River is forecast to have below-normal flows in September, and low stages are expected to persist throughout the length of the Mississippi River. These low flows and stages will likely impact industry and navigation.
Report Your Local Impacts
As conditions evolve, accurate reports on conditions and drought impacts are critical. Whether your area is currently wet, close to normal, or dry, please consider reporting conditions and any drought impacts you see or hear via the Condition Monitoring Observer Reports (CMOR) from the National Drought Mitigation Center. If you are already a CoCoRaHS observer, we encourage you to submit a Condition Monitoring Report.
Current Conditions
Figure 1. U.S. Drought Monitor for the Midwest (Valid August 22, 2023)
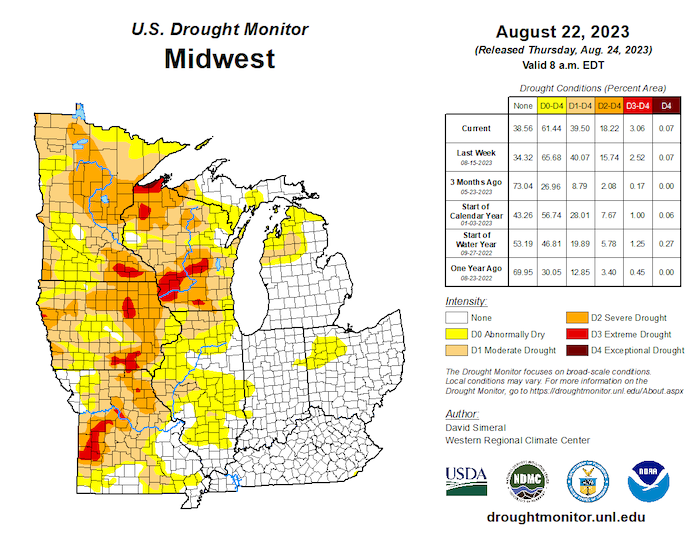
Figure 2. 7-Day Accumulated Precipitation (inches) (August 17–23, 2023)
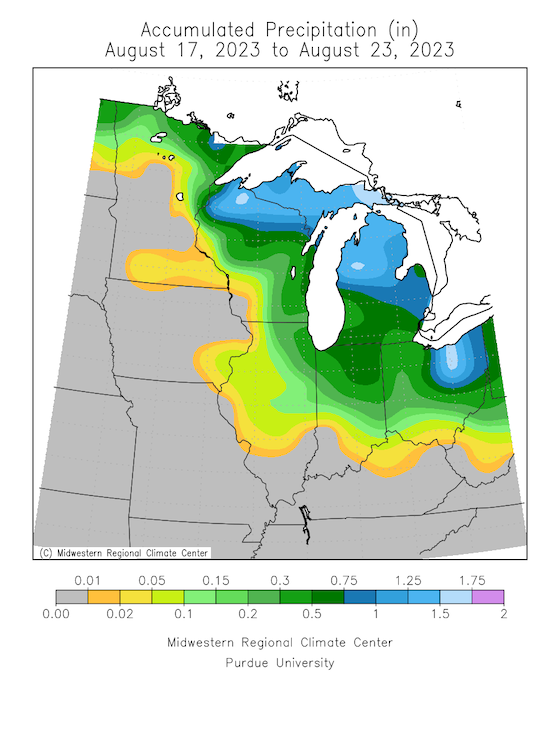
Figure 3. 1-Week U.S. Drought Monitor Change Map (Since August 15, 2023)
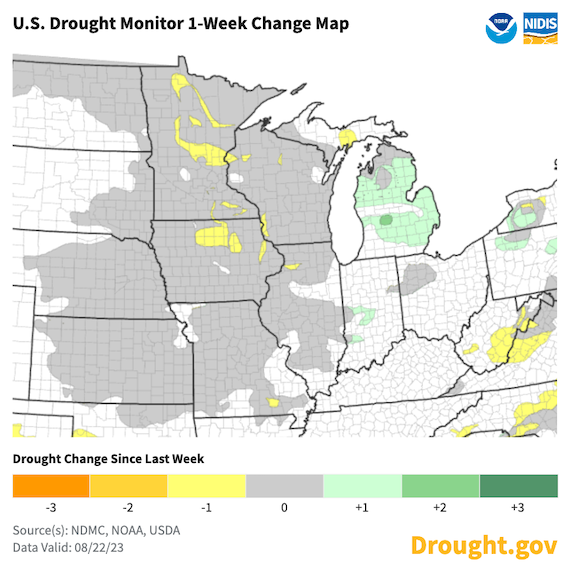
Figure 4. Ohio River Stage at Cairo, IL as of August 25, 2023
Outlooks & Forecasts
Figure 5. Quantitative Precipitation Forecast for the Next 7 Days (August 25–September 1, 2023)

Figure 6. 8–14 Day Temperature Outlook (Valid August 31–September 6, 2023)
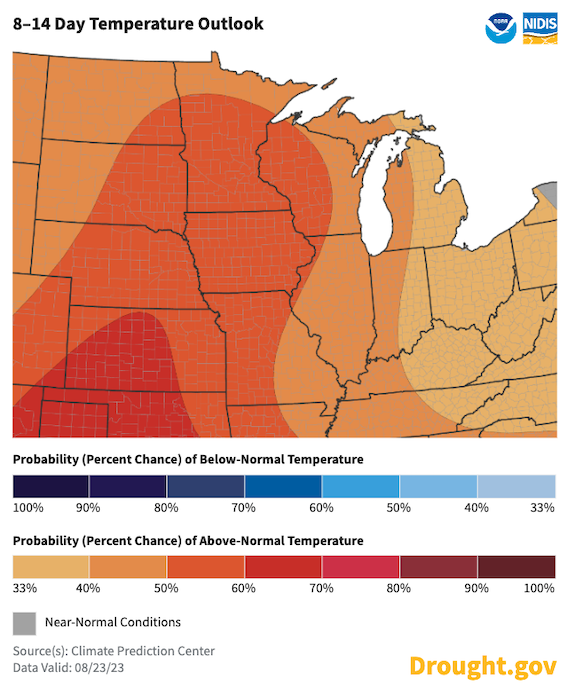
Figure 7. 8–14 Day Precipitation Outlook (Valid August 31–September 6, 2023)
Resources
Resources for Monitoring Drought & Heat Risk
- Keep track of the risk for extreme heat in the next 3–7 days with the U.S. Day 3–7 Hazards Outlook.
- Keep track of the risk of rapid drought onset and heat risk in the next 8–14 days with the U.S. Week 2 Hazards Outlook.
- Keep track of how much soil moisture there is compared to normal with various soil moisture products.
- Keep track of temperatures across the region with the Midwest Climate Watch Daily Maps for the Central U.S.
Heat Health Resources
- Climate and Health Outlook – August 2023 from the Department Health and Human Services
- Heat Illness Prevention information from the National Integrated Heat Health Information System (NIHHIS).
- Tips on staying safe in extreme heat from the Centers for Disease Control and Prevention (CDC).
- Heat Safety Tips and Resources from the National Weather Service.
For More Information
- NIDIS and its partners will issue future updates as conditions evolve.
- A special thank you to the state climate offices and National Weather Service offices in the Midwest for providing local information on drought conditions and impacts included in the webinar and on this report.
- More local information is available from the following resources:
- To report or view local drought impact information:
- Report your Drought Impacts through Condition Monitoring Observer Reports (CMOR).
- View CoCoRaHS Condition Monitoring reports.
- Register for the next North Central U.S. Climate and Drought Summary & Outlook Webinar on September 21, 2023, which will provide more information about conditions, impacts, and outlooks.
Prepared By
Molly Woloszyn
NOAA/National Integrated Drought Information System (NIDIS), CIRES/CU Boulder
Doug Kluck
NOAA/National Centers for Environmental Information
Dennis Todey & Laura Nowatske
USDA Midwest Climate Hub
Audra Bruschi
NOAA/National Weather Service Central Region
Jim Noel & Mike Welvaert
NOAA/Ohio and North Central River Forecast Center
Melissa Widhalm
Midwestern Regional Climate Center/Purdue University
Hunter Jones & Morgan Zabow
NOAA/National Integrated Heat Health Information System
This drought status update is issued in partnership between the National Oceanic and Atmospheric Administration (NOAA) and the U.S. Department of Agriculture (USDA) to communicate a potential area of concern for drought expansion and/or development within the Midwest based on recent conditions and the upcoming forecast. NIDIS and its partners will issue future drought status updates as conditions evolve.