Drought has steadily expanded and intensified across the Southeast with impacts to soils, agriculture, fire risk, and water resources.
Dry conditions are expected to persist for much of early November, with some relief by late-November. Drought is anticipated to improve as we transition into an El Niño winter, which typically brings wetter-than-normal conditions.
Key Points
- According to the U.S. Drought Monitor, drought is currently impacting slightly over 50% of the Southeast region, with the most intense drought found in the western portions of the region in Tennessee, Alabama, northwest Georgia, and the Panhandle of Florida. 95% of Alabama is currently in drought, with 29% in Extreme Drought (D3). 92% of Tennessee is currently in drought, with 41% in Extreme Drought (D3) . Drought conditions have also worsened in Virginia and the Carolinas, primarily in the Mountain regions but are now expanding over the Piedmont and starting to appear along the coast. Florida’s long-term drought along the western peninsula continues to persist.
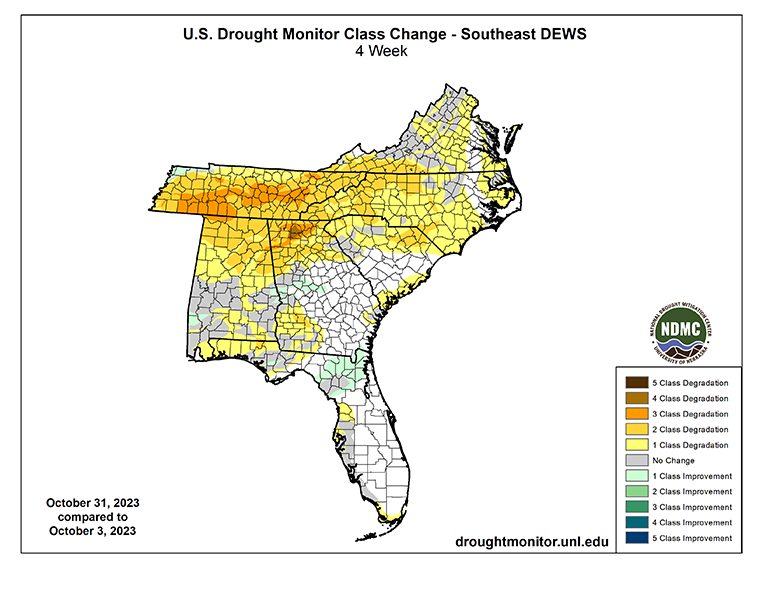
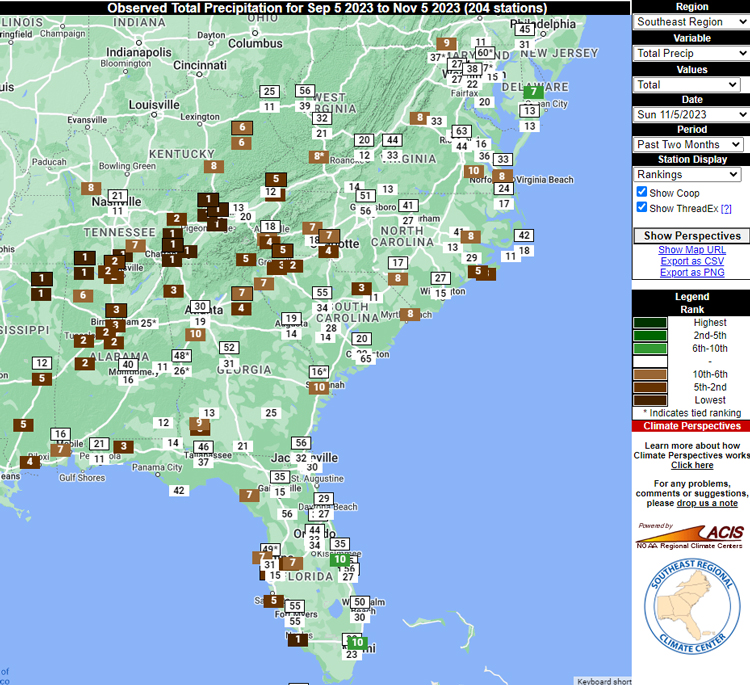
- Drought conditions are quickly expanding, with all states experiencing at least a 2-class degradation in U.S. Drought Monitor classification over the past month (Figure 1) and many locations experiencing some of the driest falls on record (Figure 2). In southern Tennessee, for example, Extreme Drought (D3) increased by 33% last week alone. These rapid-onset (“flash”) fall droughts in the Southeast resemble what was observed in 2016, 2019, and 2022.
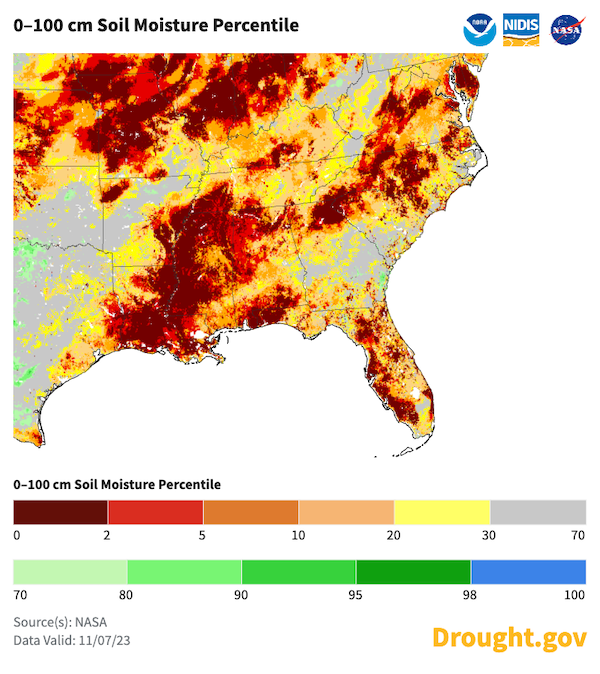
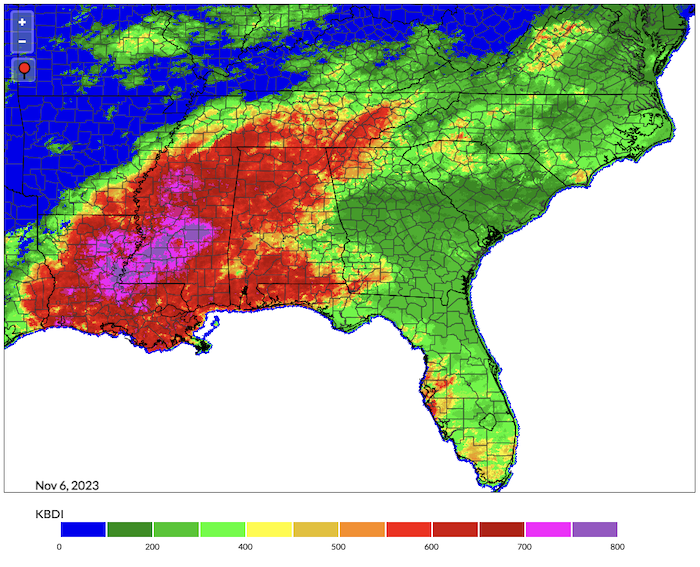
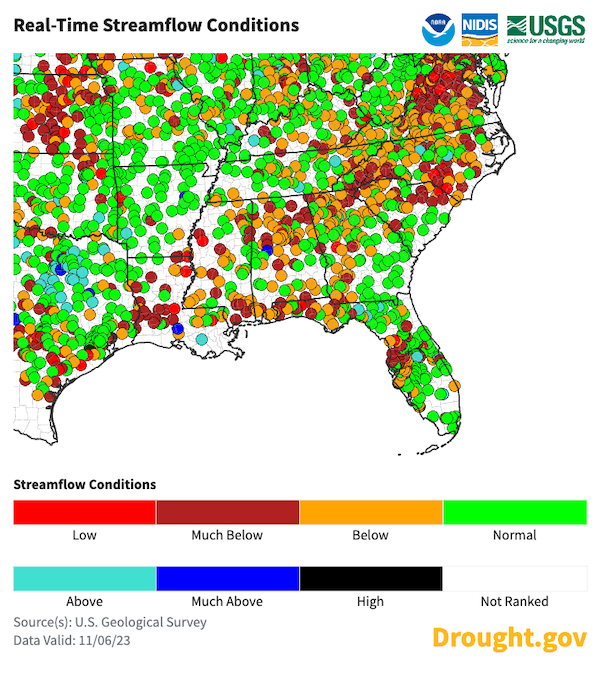
- Despite isolated precipitation events and Hurricane Ophelia in September, this steady dryness has led to a notable loss of soil moisture (Figure 3), which is impacting crop yields, pond levels, winter planting, forage quantity and quality, and resulting in supplemental livestock feeding. USDA has announced ‘Drought Disaster Declarations’ for many counties in Northern Alabama. Fire risk in November continues to increase (Figure 4) during this fall wildfire season with fire danger elevated and burn bans in effect for many locations. There are many areas experiencing declining levels of streamflows (Figure 5) and reservoirs, resulting in some voluntary water restrictions.
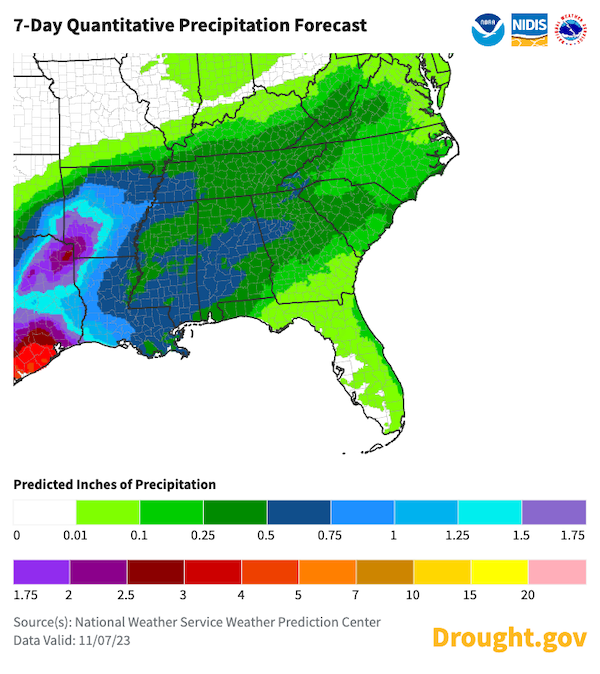
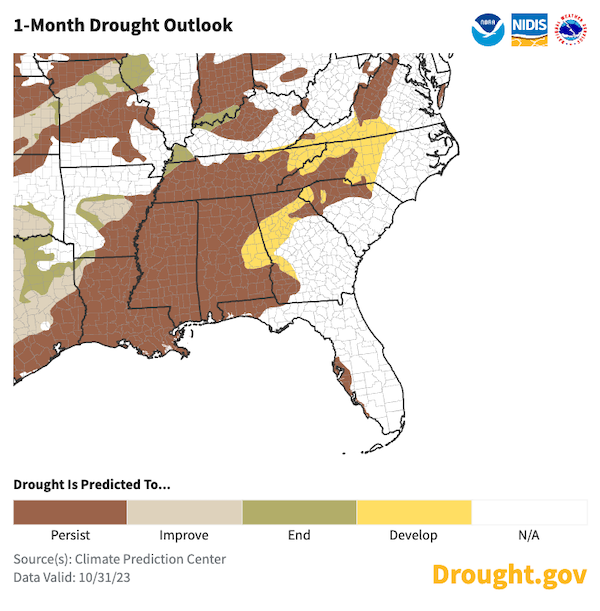
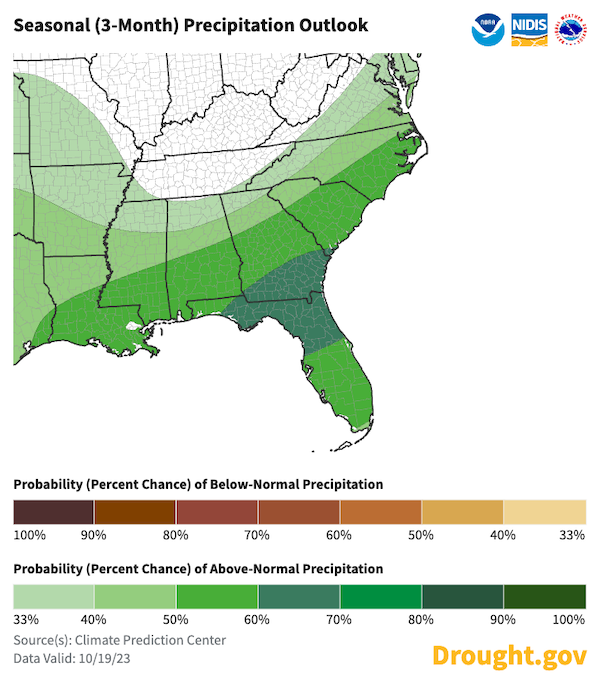
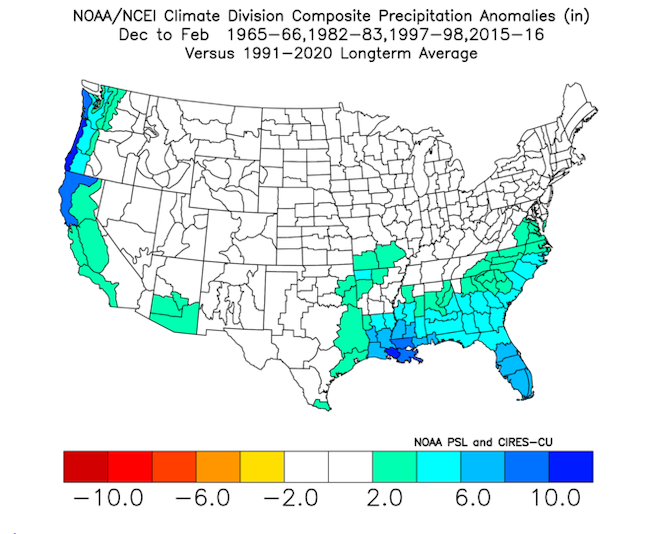
- While drought is anticipated to expand in November, especially in northern Georgia and western North Carolina (Figure 6), near-term forecasts indicate that some relief may be on the way this weekend, especially to Tennessee and northern Mississippi (Figure 7). While November is typically the driest month of the year for much of the Southeast, seasonal models indicate an increased likelihood of above-normal precipitation in much of the region (Figure 8), this winter due to an expected strong El Niño pattern that typically brings increased winter precipitation to the Southeast. (Figure 9). Learn more about what this El Niño means during this November 28 webinar.
- Potential near-term impacts of persistent drought include the continuation of low water levels on major rivers and tributaries. However, river levels typically rebound in the winter due to seasonal and climatological trends.
U.S. Drought Monitor map for the Southeast, as of October 31, 2023. The U.S. Drought Monitor is updated each Thursday to show the location and intensity of drought across the country.
The map uses 5 classifications: Abnormally Dry (D0), showing areas that may be going into or are coming out of drought, and four levels of drought (D1–D4). The U.S. Drought Monitor is a joint effort of the National Oceanic and Atmospheric Administration, U.S. Department of Agriculture, and National Drought Mitigation Center.
U.S. Drought Monitor
D0 - Abnormally Dry
Abnormally Dry (D0) indicates a region that is going into or coming out of drought, according to the U.S. Drought Monitor. View typical impacts by state.
D1 – Moderate Drought
Moderate Drought (D1) is the first of four drought categories (D1–D4), according to the U.S. Drought Monitor. View typical impacts by state.
D2 – Severe Drought
Severe Drought (D2) is the second of four drought categories (D1–D4), according to the U.S. Drought Monitor. View typical impacts by state.
D3 – Extreme Drought
Extreme Drought (D3) is the third of four drought categories (D1–D4), according to the U.S. Drought Monitor. View typical impacts by state.
D4 – Exceptional Drought
Exceptional Drought (D4) is the most intense drought category, according to the U.S. Drought Monitor. View typical impacts by state.
U.S. Drought Monitor map for the Southeast, as of October 31, 2023. The U.S. Drought Monitor is updated each Thursday to show the location and intensity of drought across the country.
The map uses 5 classifications: Abnormally Dry (D0), showing areas that may be going into or are coming out of drought, and four levels of drought (D1–D4). The U.S. Drought Monitor is a joint effort of the National Oceanic and Atmospheric Administration, U.S. Department of Agriculture, and National Drought Mitigation Center.
The U.S. Drought Monitor is updated weekly on Thursday mornings, with data valid through the previous Tuesday at 7 a.m. ET.
Report and View Local Impacts
As conditions evolve, accurate reports on conditions and drought impacts are critical. Whether your area is currently wet, close to normal, or dry, please consider reporting conditions and any drought impacts you see or hear via the Condition Monitoring Observer Reports (CMOR) from the National Drought Mitigation Center. If you are already a CoCoRaHS observer, we encourage you to submit a Condition Monitoring Report. You can also view local drought impact information through the above.
Current Conditions and Drought Impacts
Current Conditions
Overall, conditions were largely drier-than-normal since the summer across a majority of the region (Figure 1) and continued to degrade across the region, except where isolated precipitation events occurred, such as recent rainfall across Northwest Tennessee.
Outlooks & Forecasts
For More Information
NIDIS and its partners will issue future updates as conditions evolve.
Upcoming Informational Webinars
Upcoming informational webinars related to drought in the Southern and Southeast U.S.:
- Impacts and Perspectives on the 2023 Southern US Drought and Heat will include the current lower Mississippi River drought. November 8, 12 - 1 p.m. CT. Learn more and register.
- The Southeast Monthly Climate Webinar will include a special presentation on the current El Niño and a Winter Outlook for the Southeast. November 28, 10 - 11 a.m. ET. Learn more and register.
- Special ACF and ACT Basin Drought Webinar. This webinar will discuss the current drought conditions and impacts in the Apalachicola-Chattahoochee-Flint (ACF) and the Alabama-Coosa-Tallapoosa (ACT) River Basin. November 15, 11 a.m.-12 p.m. ET/10-11 a.m. CT. Register here.
Local Resources
More local information is available from the following resources.
- Alabama: ADECA Drought Planning and Management; Office of the Alabama State Climatologist, Alabama Drought Reach
- Florida: Florida Climate Center; Florida Weekly Drought Summary (Infographic)
- Georgia: Georgia EPD Drought Management; Office of the Georgia State Climatologist
- North Carolina: North Carolina Drought Management Advisory Council; North Carolina State Climate Office
- South Carolina: South Carolina Drought Page; South Carolina State Climatology Office
- Tennessee: Tennessee Weekly Drought Summaries; Tennessee Climate Office
- Virginia: Virginia DEQ Drought Page
Additional local, state, and regional information:
- View active National Weather Service Drought Information Statements at the local level.
- Drought.gov state pages with maps and resources for Alabama, Florida, Georgia, North Carolina, South Carolina, Tennessee, Virginia.
- County and city level information on drought.gov.
- In the Apalachicola-Chattahoochee-Flint (ACF) River Basin? Visit the ACF Drought and Water Dashboard.
- In the Alabama-Coosa-Tallapoosa (ACT) River Basin? Visit the ACT Drought and Water Dashboard.
- Get Email Alerts When Local Drought Conditions Change.
- Sign up for the Southeast Drought Early Warning System (SE DEWS) listserv to receive updates about the region, ongoing drought conditions, and upcoming events and webinars.
Prepared By
Meredith Muth
NOAA/National Integrated Drought Information System (NIDIS)
This Drought Status Update is issued to communicate a potential area of concern for drought expansion and/or development within the Southeast U.S. based on recent conditions and the upcoming forecast. NIDIS and its partners will issue future Drought Status Updates as conditions evolve.