Minimal Drought Across the Midwest, but Hot and Dry Weather Expands Drought in Ohio and Kentucky
Key Points
- According to the U.S. Drought Monitor, only 4% of the Midwest region is in drought (Moderate to Severe Drought [D1-D2]), with an additional 7% considered Abnormally Dry (D0).
- Spring and early summer rainfall completely alleviated drought concerns across the Midwest; the region was drought-free on the June 11 U.S. Drought Monitor. However, the reprieve was short-lived as extreme heat and below-normal rainfall drove the expansion of drought in Ohio and Kentucky over the last 5 weeks.
- Drought impacts emerged in parts of Ohio and eastern Kentucky. In both states, soil moisture is below normal, and crops are stressed in some areas. Pasture conditions are fair to poor and a concern in southern and eastern Ohio. Streamflows are below normal, especially in Ohio.
- While the flows from the Ohio River Basin are a major contributor to the Lower Mississippi River, above-normal streamflow from the Upper Mississippi River and Missouri River is enough to offset the lower flows from the Ohio River and alleviate low level concerns on the Lower Mississippi River through at least mid- to late August.
- A heat wave is forecast for much of the continental U.S. in late July through at least early August, where heat index values will reach or exceed 100°F in many places.
- Outlooks call for above-normal temperatures for the remainder of summer in the Midwest. A pattern change for rainfall is forecast with below-normal rainfall expected in parts of the Missouri and Upper Mississippi Basins and near- to above-normal rainfall anticipated in parts of the Ohio to Tennessee Valley Basins. This will likely create changing conditions with areas of drought development and improvement.
- Areas that receive below-normal precipitation over the coming months may be at risk for worsening or developing drought conditions due to predicted above-normal temperatures.
The U.S. Drought Monitor depicts the location and intensity of drought across the country. The map uses 5 classifications: Abnormally Dry (D0), showing areas that may be going into or are coming out of drought, and four levels of drought (D1–D4).
The U.S. Drought Monitor is a joint effort of the National Oceanic and Atmospheric Administration, U.S. Department of Agriculture, and National Drought Mitigation Center.
A drought index combines multiple drought indicators (e.g., precipitation, temperature, soil moisture) to depict drought conditions. For some products, like the U.S. Drought Monitor, authors combine their analysis of drought indicators with input from local observers. Other drought indices, like the Standardized Precipitation Index (SPI), use an objective calculation to describe the severity, location, timing, and/or duration of drought.
Learn MorePeriods of drought can lead to inadequate water supply, threatening the health, safety, and welfare of communities. Streamflow, groundwater, reservoir, and snowpack data are key to monitoring and forecasting water supply.
Learn MoreDrought can reduce the water availability and water quality necessary for productive farms, ranches, and grazing lands, resulting in significant negative direct and indirect economic impacts to the agricultural sector. Monitoring agricultural drought typically focuses on examining levels of precipitation, evaporative demand, soil moisture, and surface/groundwater quantity and quality.
Learn MoreU.S. Drought Monitor Categories
D0 - Abnormally Dry
Abnormally Dry (D0) indicates a region that is going into or coming out of drought. View typical impacts by state.
D1 - Moderate Drought
Moderate Drought (D1) is the first of four drought categories (D1–D4), according to the U.S. Drought Monitor. View typical impacts by state.
D2 - Severe Drought
Severe Drought (D2) is the second of four drought categories (D1–D4), according to the U.S. Drought Monitor. View typical impacts by state.
D3 - Extreme Drought
Extreme Drought (D3) is the third of four drought categories (D1–D4), according to the U.S. Drought Monitor. View typical impacts by state.
D4 - Exceptional Drought
Exceptional Drought (D4) is the most intense drought category, according to the U.S. Drought Monitor. View typical impacts by state.
Total Area in Drought (D1–D4)
Percent area of the Midwest that is currently in drought (D1–D4), according to the U.S. Drought Monitor.
The U.S. Drought Monitor depicts the location and intensity of drought across the country. The map uses 5 classifications: Abnormally Dry (D0), showing areas that may be going into or are coming out of drought, and four levels of drought (D1–D4).
The U.S. Drought Monitor is a joint effort of the National Oceanic and Atmospheric Administration, U.S. Department of Agriculture, and National Drought Mitigation Center.
The U.S. Drought Monitor is released every Thursday morning, with data valid through the previous Tuesday at 7 a.m. ET.
A drought index combines multiple drought indicators (e.g., precipitation, temperature, soil moisture) to depict drought conditions. For some products, like the U.S. Drought Monitor, authors combine their analysis of drought indicators with input from local observers. Other drought indices, like the Standardized Precipitation Index (SPI), use an objective calculation to describe the severity, location, timing, and/or duration of drought.
Learn MorePeriods of drought can lead to inadequate water supply, threatening the health, safety, and welfare of communities. Streamflow, groundwater, reservoir, and snowpack data are key to monitoring and forecasting water supply.
Learn MoreDrought can reduce the water availability and water quality necessary for productive farms, ranches, and grazing lands, resulting in significant negative direct and indirect economic impacts to the agricultural sector. Monitoring agricultural drought typically focuses on examining levels of precipitation, evaporative demand, soil moisture, and surface/groundwater quantity and quality.
Learn MoreCurrent Conditions for the Midwest
- According to the U.S. Drought Monitor, only 4% of the Midwest region is in drought (Moderate to Severe Drought [D1–D2]), with an additional 7% considered Abnormally Dry (D0).
- Spring and early summer rainfall helped completely alleviate drought concerns across the Midwest; the region was drought free on the June 11 U.S. Drought Monitor. However, the reprieve was short-lived as extreme heat and below-normal rainfall drove the expansion of drought in Ohio and Kentucky over the last 6 weeks (Figure 1).
- Portions of the Ohio River Basin (Ohio, Kentucky) have received only 25%–75% of normal precipitation since June 11 (Figure 2). On the other hand, much of Minnesota, Iowa, Missouri, Wisconsin, and Michigan, received above-normal precipitation since mid-June.
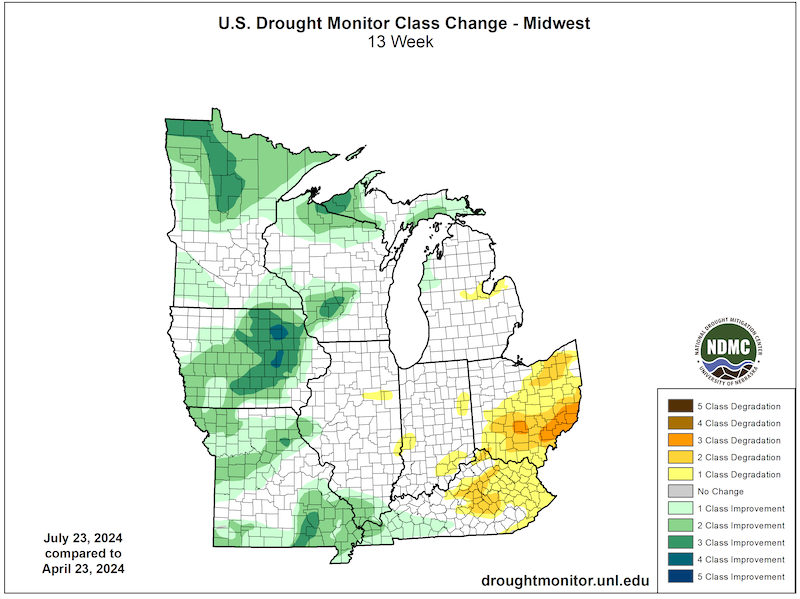
- The 13-week U.S. Drought Monitor change map shows the extreme contrast between western portions of the region (improvement) versus the eastern portions of the region (degradation) since late April (Figure 3).
Figure 1: 6-Week U.S. Drought Monitor Change Map (Since June 11, 2024)
Key Takeaway: In just 6 weeks, drought worsened by one to three categories on the U.S. Drought Monitor in portions of Ohio and Kentucky.
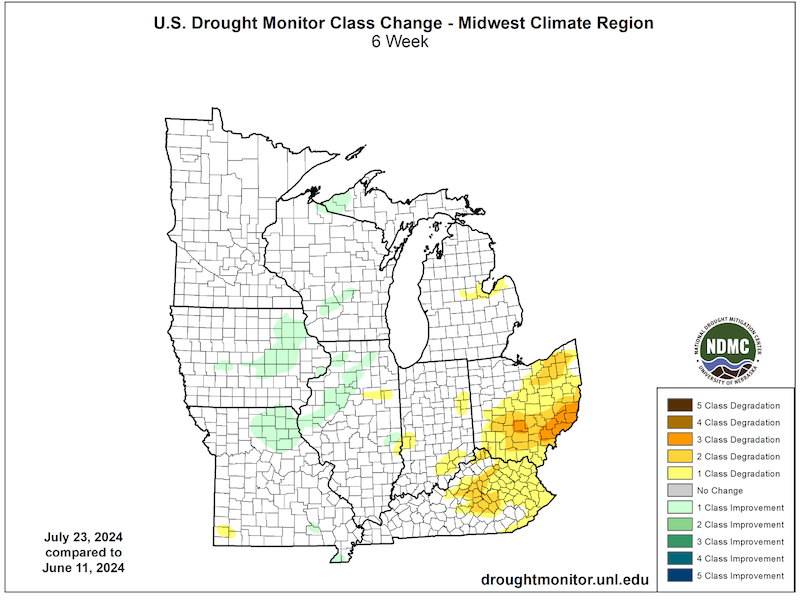
Figure 2: Accumulated Precipitation – Percent of Normal (June 11–July 24, 2024)
Key Takeaway: Portions of the Ohio River Basin received only 25%-75% of normal precipitation since June 11. Combined with hot temperatures, these conditions drove drought expansion in these areas.
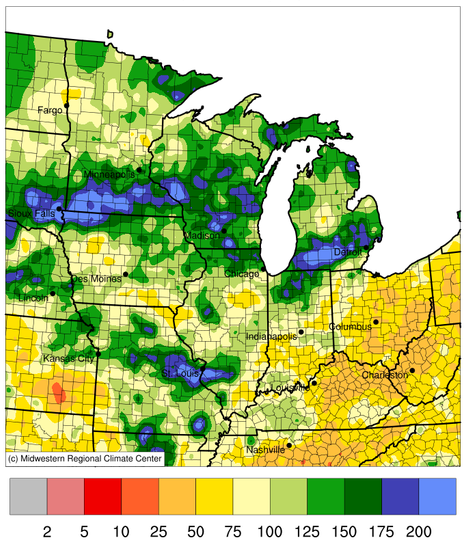
Figure 3: 13-Week U.S. Drought Monitor Change Map (Since April 23, 2024)
Key Takeaway: Drought conditions significantly improved in western portions of the region (Iowa, Minnesota, Missouri, Wisconsin, and Upper Michigan) over the last three months according to the U.S. Drought Monitor. However, drought worsened across portions of Ohio and Kentucky by one to three categories during this time frame.
Midwest Drought Impacts
- For the areas in drought in Ohio and Kentucky, drought impacts emerged.
- Soil moisture is below normal across both states (Figure 4), and crops are stressed to the point where there may be considerable yield loss.
- In Ohio, pasture conditions are very poor and a big concern across southeast Ohio.
- In both states, vegetation, including young trees, yards, and bushes are showing signs of stress.
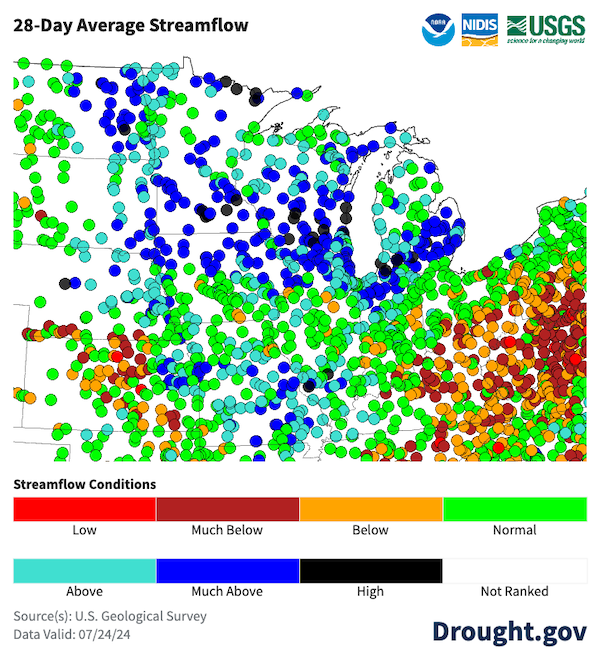
- Streamflow is below to much-below normal across Ohio and Kentucky and portions of Indiana as well. Streamflow across the northern portions of the region is above to much-above normal (Figure 5).
- The last two years (2022, 2023) saw significant low-flow issues on the Lower Mississippi River in late summer through early fall. While the flows from the Ohio River Basin are a major contributor to the Lower Mississippi River, the above-normal flows from the Upper Mississippi River and Missouri River are enough to offset the lower flows from the Ohio River and alleviate low water level concerns on the Lower Mississippi River through at least the middle of August.
Figure 4: 0–100 cm Soil Moisture Percentiles (as of July 24, 2024)
Key Takeaway: Soil moisture is below normal across portions of the Ohio River Basin, including portions of Kentucky, Ohio, and Indiana.
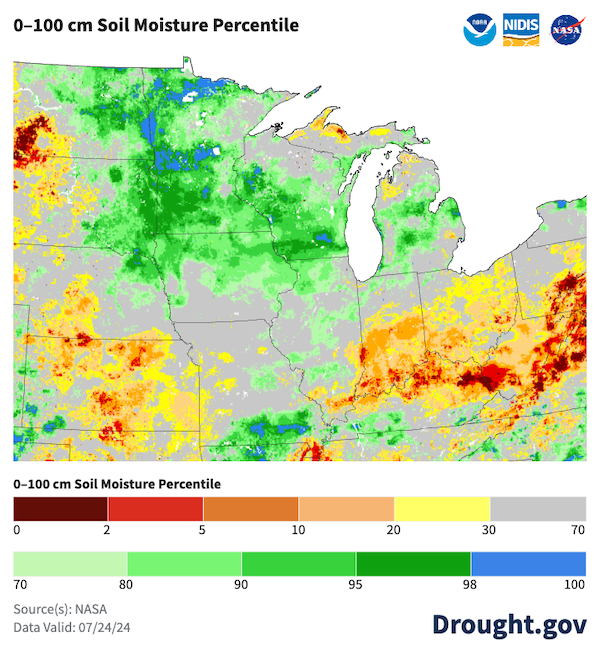
Figure 5: 28-Day Average Streamflow Conditions (Valid July 24, 2024)
Key Takeaway: Average streamflow over the last 28 days was below-normal in areas across Ohio, Kentucky, and Indiana. The Upper Midwest has above-normal streamflow.
Report your local drought impacts through a Condition Monitoring Observer Report:
Outlooks and Potential Impacts
- The 8–14 day outlook (valid for August 1–7) shows above-normal temperatures are very likely across the entire Midwest region (Figure 6), where heat index values are expected to reach above 100°F in many areas. Western portions of the region are expected to have below-normal precipitation, while other areas have increased chances for near-normal precipitation (Figure 7).
- For the month of August, above-normal temperatures are likely to continue, and for much of the region, precipitation has equal chances of being above-, below-, or near normal (Figure 8). There is an increased chance for above-normal precipitation across Kentucky.
- Outlooks call for above-normal temperatures for the remainder of summer in the Midwest. A pattern change for rainfall is forecast, with below-normal rainfall expected in parts of the Missouri and Upper Mississippi Basins, and near- to above-normal rainfall anticipated in parts of the Ohio to Tennessee Valley Basins.
- Because of expected rainfall, the seasonal drought outlook shows drought in Ohio and Kentucky is likely to improve or be removed completely by the end of October. Drought is not expected to develop elsewhere in the Midwest through the end of October (Figure 9).
- Some areas across the Midwest have significant long-term precipitation deficits, and others just came out of drought (Iowa, Illinois, Missouri, Minnesota, and Wisconsin). If these areas receive below-normal precipitation in the coming months, they may be at risk for worsening drought conditions due to the predicted above-normal temperatures.
- Some low water issues on the Mississippi River are typical each fall (between September and December), as this is the driest season for much of the Mississippi Basin. However, extremely low flows are unlikely at this time.
Figure 6: 8–14 Day Temperature Outlook (August 1–7, 2024)
Key Takeaway: Above-normal temperatures are very likely across the Midwest region from August 1–7.
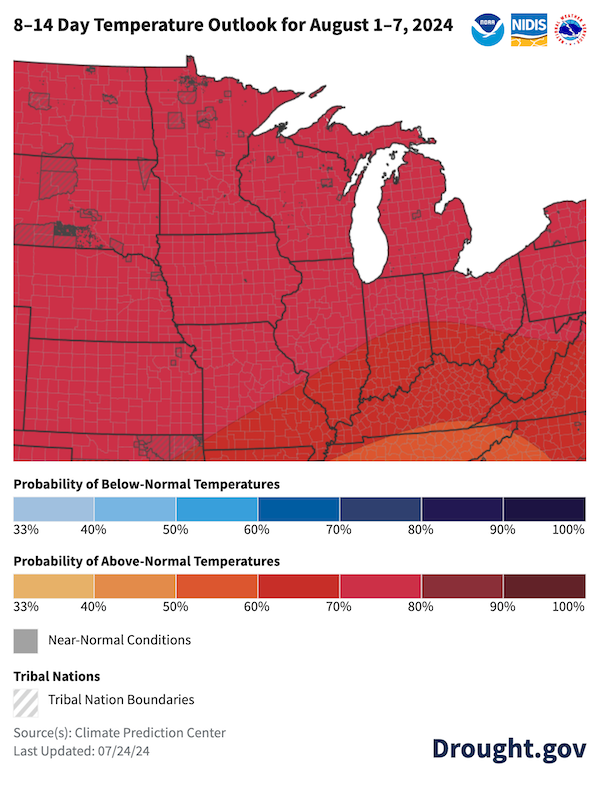
Figure 7: 8–14 Day Precipitation Outlook (August 1–7, 2024)
Key Takeaway: Western areas of the Midwest have increased chances for below-normal precipitation from August 1–7, and other areas are expected to receive near-normal precipitation.
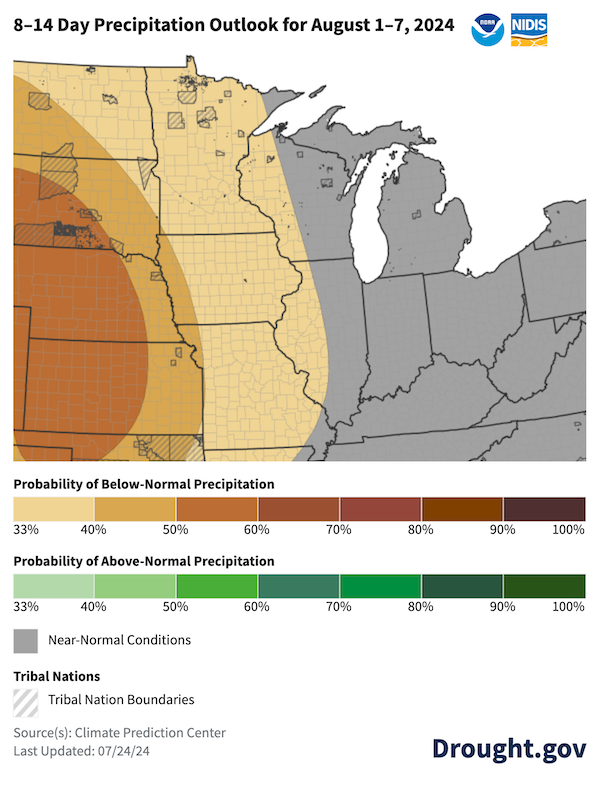
Figure 8: August 2024 Precipitation Outlook
Key Takeaway: A majority of the region has equal chances for above-, below-, or near-normal precipitation during August 2024. There is an increased chance for above-normal precipitation across Kentucky.
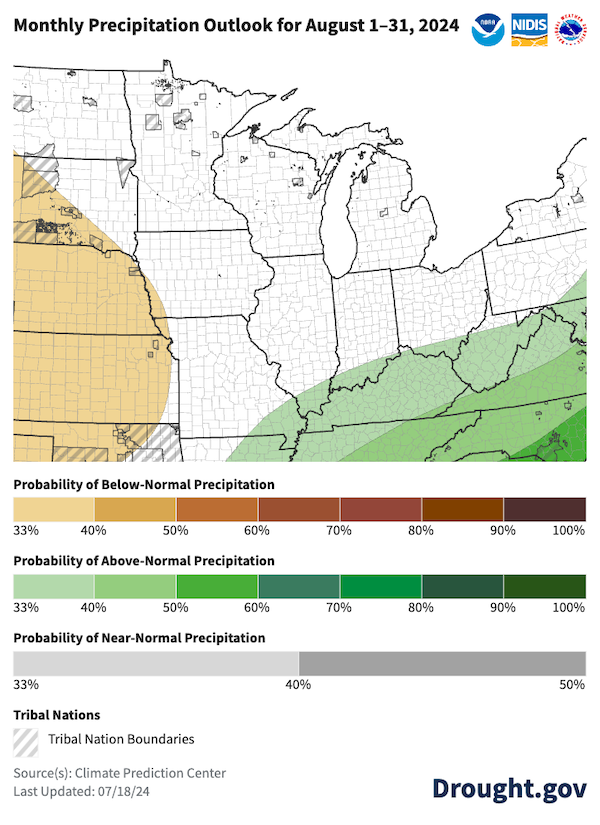
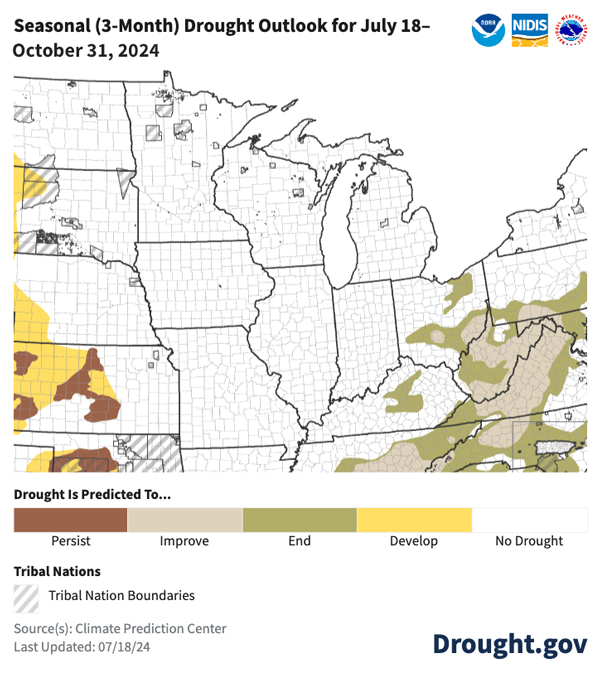
Figure 9: Seasonal Drought Outlook for July 18–October 31, 2024
Key Takeaway: Drought will likely improve or be removed in areas of Ohio and Kentucky between July 18–October 31 and is not expected to develop elsewhere in the Midwest.
Resources
For More Information
- More local information is available from the following resources:
- To report or view local drought impact information:
- Register for the North Central U.S. Climate and Drought Summary & Outlook Webinar on Thursday, August 15 at 1 p.m. CT, which will provide updated information about conditions, impacts, and outlooks.
Prepared By
Molly Woloszyn
Cooperative Institute for Research in Environmental Sciences (CIRES), University of Colorado Boulder
NOAA National Integrated Drought Information System (NIDIS)
Doug Kluck
NOAA National Centers for Environmental Information
Dennis Todey & Laura Nowatske
USDA Midwest Climate Hub
Audra Bruschi & Maren Stoflet
NOAA/National Weather Service Central Region
Jim Noel & Mike Welvaert
NOAA/National Weather Service/Ohio and North Central River Forecast Center
Anna Wolverton
U.S. Army Corps of Engineers Mississippi Valley Division/NOAA National Weather Service
Melissa Widhalm
Midwestern Regional Climate Center/Purdue University
Denise Gutzmer
National Drought Mitigation Center
A special thank you to the state climate offices and National Weather Service offices in the Midwest region for providing local information on drought conditions and impacts included in the webinar and in this Drought Status Update.
This Drought Status Update is issued in partnership between the National Oceanic and Atmospheric Administration (NOAA), U.S. Department of Agriculture (USDA), U.S. Army Corps of Engineers (USACE), and the National Drought Mitigation Center to communicate a potential area of concern for drought expansion and/or development within the Midwest region based on recent conditions and the upcoming forecast. NIDIS and its partners will issue future Drought Status Updates as conditions evolve.